Another winter season in the books and once again the region averaged warmer than normal
Over the past decade or so, winters have found a way to average warmer than normal across much of the U.S., regardless of the state of the equatorial Pacific – La Niña or El Niño. This has been especially true for the northern tier of the country. Since at least 2010, the vast majority of December-through-February periods have managed to end up above normal to well above
normal.
The odd thing about the winter patterns of late is that there is usually one month that features significant cold, but it is never cold enough to offset the warm anomalies of the other two winter months. There have been years, such as 2020 and 2019, where the early through mid-spring periods ran colder than normal. This chipped away at that degree day deficits that developed during the heart of the heating season, but it was never enough to get the heating degree day totals back to normal or above for the vast majority of the region.
Once again, this winter season we saw one very cold period for the nation. This time it was February. In fact, for some central U.S. locations it was historically cold during the February outbreak, but that was not enough to overcome the persistent warmth of the December and January months. Unlike some recent winters, the Northeast did not see any truly balmy weather during the December/January period, but temperatures were still consistently higher than normal, even when the basic footprint pattern suggested the period should have trended normal or somewhat colder than normal.
In this article, I will take a look at the basic upper-level pattern that held sway across the country during this past winter season.
___________
As was discussed during the early fall of 2020, there were clear signs that the upcoming winter was going to feature a La Niña pattern with colder than normal conditions persisting along the equatorial Pacific (Editor’s note: see “La Niña Is a Lock” from October 2020 issue). Well, we did in fact see a La Niña pattern this past winter, but it certainly did not feature a classic La Niña North American response.
Most La Niña winters favor the best potential for persistent colder than normal conditions to exist across the north-central states, especially close to the Canadian border area. If eastern upper air ridging is weak or infrequent, the potential often favors enough cold air spilling eastward from the north-central states on into the Northeast to keep our wintertime temperature average close to normal with some decent cold periods. A La Niña winter is not a lock for a cold Northeast winter, but often they do not stray too far from normal and do leave the door open for some decent cold periods.
Here is the temperature anomaly map for the December 2020 through February 2021 period.
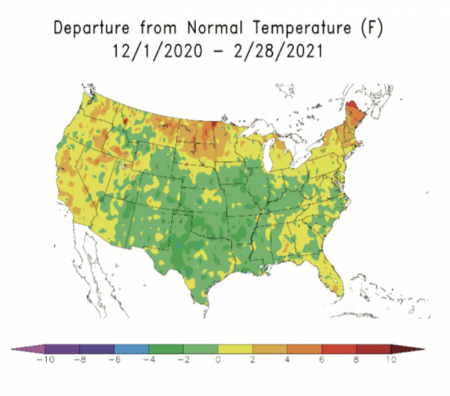
Note the warmest anomalies ran from the north-central states eastward across the Great Lakes and New England. Meanwhile, the coldest portion of the country was from the eastern slopes of the Rockies into the Midwest on southward across the Southern Plains and most of the lower Mississippi Valley region. This anomalous outcome is almost the complete opposite of what the long-term La Niña composite would suggest.
As to why this might be the case, I’m not sure anyone really has a good answer. The simplest explanation is that the La Niña composite is, like all other composites, nothing more that the average of many years of La Niña events. Within those dozens of occurrences, there are always going to be years that do not follow the average but get blended into the composite.
Some folks — and I am starting to lean in this direction — believe that the long running composites we have been using for several decades are no longer valid in the current global warming period. Over the past several years, we have seen both La Niña and El Niño events stray significantly from the composites we have come to rely on for our background forecast. If this is indeed the case, the already incredibly challenging game of seasonal forecast just got even more difficult!
There does seem to be some solid evidence that the warming of the tropical oceans is causing a northward expansion of the Hadley Cell (the large-scale atmospheric circulation feature located at the equator to about 30 degrees north latitude). If the Hadley Cell is indeed expanding northward, it certainly would have an impact on the evolution and characteristics of La Niña and El Niña events. Unfortunately, it will take a few years to incorporate these changes into the composites so frequently used for long-range forecasting.
We have also noted a general increase in wind speeds at jet stream level from the Pacific on eastward across the U.S. into the Atlantic. It is postulated that this increase in jet stream flow is being caused by the northward expansion of the Hadley Cell, which in turn tightens the upper-level thermal gradient between the equator and the poles. This faster flow may well be hindering the amount of upper level (jet stream) phasing we are seeing, which then decreases the frequency of polar and arctic intrusions. Arctic and polar intrusions still occur, but with less frequency and shorter staying power as the faster flow helps keep them bottled up for longer periods.
All food for thought…
________________
Now back to this past winter. I have already shown the winter season temperature anomaly, which again featured the core of the warmest conditions running from the Northern Plains eastward into New England – the opposite of normal La Niña expectations.
The average upper-level flow featured a mean western ridge and a mean east-central Canadian ridge. While a western ridge is normally good for frequent cold delivery into the central states, which can then spread into the Northeast, the amplitude of the ridge was not great enough this season to consistently tap into western Canadian arctic air. This allowed mild air streams off the North Pacific to dominate the air mass characteristic coming into and across the north-central region (maybe the result of the fast flow). When the ridge did amplify significantly, those amplification periods were relatively short-lived. Yes, they did deliver cold air masses into the central and eastern states, but they were not able to stick around long, and the milder air masses were quick to return.
As stated earlier, while this winter was warmer than normal, it did not feature some of the unusual warmth of the past two winters. The warmth was more a product of the upper-level flow not being able to sustain northwesterly flows into the country, other than during the February arctic attack. The flow trended zonal (west to east) more often than not!
Here (Fig. 1) is the upper-level anomaly map for the winter.
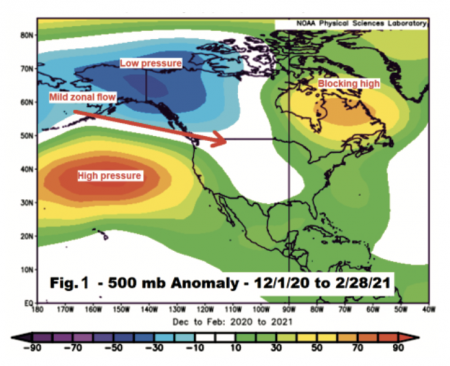
The blocking high in eastern Canada is often a pretty decent cold signal as it usually forces Canadian air masses southward into and across the Northeast. But the problem is the higher than normal pressures across the central/northeast Pacific and the lower pressures across western Canada. This configuration, which is one I chatted about during my winter update presentations in the fall, features the warm signal for a La NiÑa but usually does not persist for long periods; this year it was the favored mode. If you flip the western anomalies with higher heights across western Canada and lower heights across the northeast Pacific, the winter pattern quickly trends cold.
If the western anomalies had flipped consistently and the blocking high signal across eastern Canada was also in place, the winter would have been significantly colder than normal. However, that was only the case in February, when the anomalies did flip.
________________
As for the pattern’s impact on heating demand across the Northeast, we all know how that went. Here is the heating degree day anomaly map for December 2020 through February 2021.
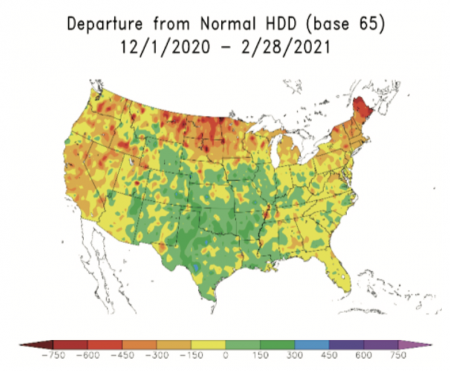
This is pretty much a carbon copy of the winter temperature anomaly map: greater than normal heating demand across much of the central and southern Plains regions, with below normal heating demand dominating the far north-central states on eastward into New England.
The heating demand anomalies across the central states are almost completely the result of brutal cold during the historic February outbreak.
Here is a closer look at the heating degree day departures for the Northeast.
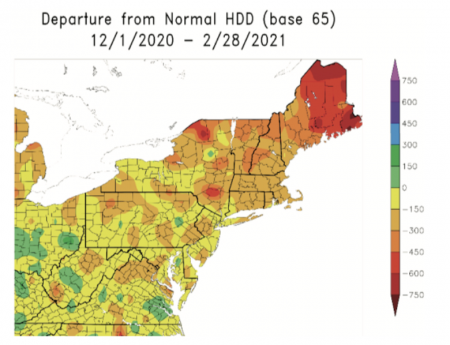
Across most of eastern New York and New England departures were in the -150 to -450 range, with eastern Maine looking at -450 to -750 departures. Central and western New York on southward into Pennsylvania, New Jersey, Delaware and Maryland ended up in the -50 to -300 range.
There were a couple of climate sites in north-central New York and central Pennsylvania that managed to see slight positive departures, but those were exceptions to the rule. The Albany, New York area finished the winter season with only a -29 degree day total for December through February. This was much less of a negative departure than that seen in surrounding areas.
Given the vast coverage of lower than normal heating degree day totals, these localized areas of above or near normal heating degree day totals were not a product of the large-scale pattern. Rather, they were more than likely caused by localized cloud variability conditions: more days with cloud cover, which limited solar radiation, and clearer nights that allowed for better radiational cooling than in other climate sites.
________________
In summary, the 2020-21 winter season for the Northeast will go into the books as a solidly warmer than normal one with the vast majority of the region reporting below normal heating degree day totals. The main reason for the winter playing out as it did was that this year’s La Niña favored the upper air pattern featuring lower than normal pressures across western Canada and higher than normal pressures across the eastern Pacific just west of northern California, Oregon and Washington.
This configuration kept the favored mean flow from the Pacific into the Northern Plains and Great Lakes zonal (west to east) in nature with no persistent northwesterly component. This type of upper-level flow pattern is not uncommon to La Niña events, and I had actually talked about the warm setup of some La Niña patterns back in the fall, but it was unusually long-lasting and did not frequently allow the cold La Niña look to take over. The above normal heights we saw across eastern Canada normally would have been a decent cold signal, but it was not able to overcome the nature of the zonal flow coming across the country.
When the upper-level height pattern across the Pacific, the western U.S. and western Canada did flip in February, a brutally cold pattern developed across the central U.S. and some of that cold did spread into the Northeast. But it was not sustainable and had been preceded by two months of above normal conditions.
How much of a role the changing global climate pattern played in this year’s La Niña is uncertain (at least in my mind), but I am assuming it played some role. Obviously, we have much to contemplate moving forward.
John Bagioni provides 10-day temperature and heating degree day forecasts, storm updates, and webinars to heating fuel dealers via the Northeast Energy Weather Service, available FREE to NEFI members with their 2021 membership dues. Visit nefi.com/join to join NEFI or email benefits@nefi.com for more information.
