
Heavy demand or supply shocks could lead to a price blowout
Cash market differentials to NYMEX HO (ULSD) futures spiked early last heating season, with weak stock levels at the end of September. Inventories were stronger entering this heating season, but still weak compared to historical norms. Are we due for another basis blowout this winter? There were a number of parallels between this year and last at the start of the heating season, on top of the low inventories. Russia was making headlines, front-month NYMEX ULSD (HO) prices were similar, crack spreads were relatively wide (especially the heat crack), and the winter was expected to be warmer than normal. Looking more closely, however, we can see a number of differences as well.
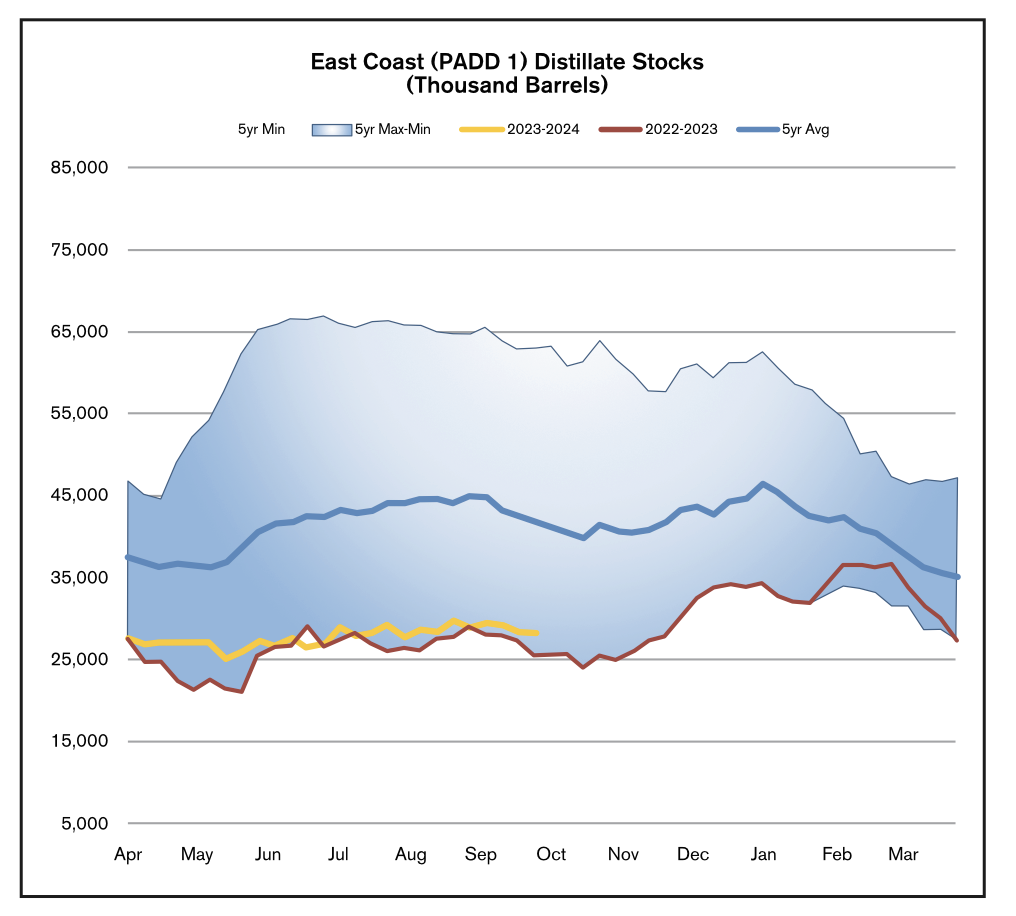
We have one very important factor in common with last season: low East Coast distillate stock levels. All else equal, low inventory levels make basis blowouts more likely as there is a smaller cushion available to help absorb the impact of any demand spikes, such as a polar vortex bringing frigid temperatures, or supply shocks such as troubles with pipeline operations or ship traffic. This year, according to data from the Energy Information Administration, we ended September at 28.16 million barrels (mb), which is 10.9% higher than last year’s levels of 25.51mb. However, we set weekly five-year lows in all of the reporting weeks from April 2022 through the end of January 2023. Thus, while current stocks are elevated compared to those lows, they are much lower than normal. In fact, East Coast distillate inventories were 32.8% below the five-year average for the reporting week ended September 29.
Futures prices ended September quite similarly to last year. NYMEX HO settled at $3.3622/g on September 29, incredibly close to the $3.3690 settlement price from September 30, 2022. Likely helping to support prices were the low stock levels mentioned above, but also low inventory levels in other locations: European diesel inventories ended the month of August at an 8% deficit to their 10-year average, and Singapore inventories were 31% below their 10-year average.
When it comes to production, however, the flat price is not as important as is the crack spread – a proxy for refining economics. The spread between the ICE Brent crude oil futures contract and the NYMEX HO (ULSD) futures contract was $53.54/bbl on September 30, 2022, and a similar, but narrower, $45.90/bbl on September 29, 2023. The crack spread contracted sharply in the following trading sessions, however, as there was a sell-off as of this writing in early October. Refiners would be keeping an eye on this crack spread as they wrapped up refinery maintenance and ramped production back up, typically shifting yields towards distillates relative to the summer when gasoline production is favored. This looked set to be true this winter, with a heat crack of $37.55/bbl on October 5 being much wider than the $7.04/bbl gasoline crack spread.
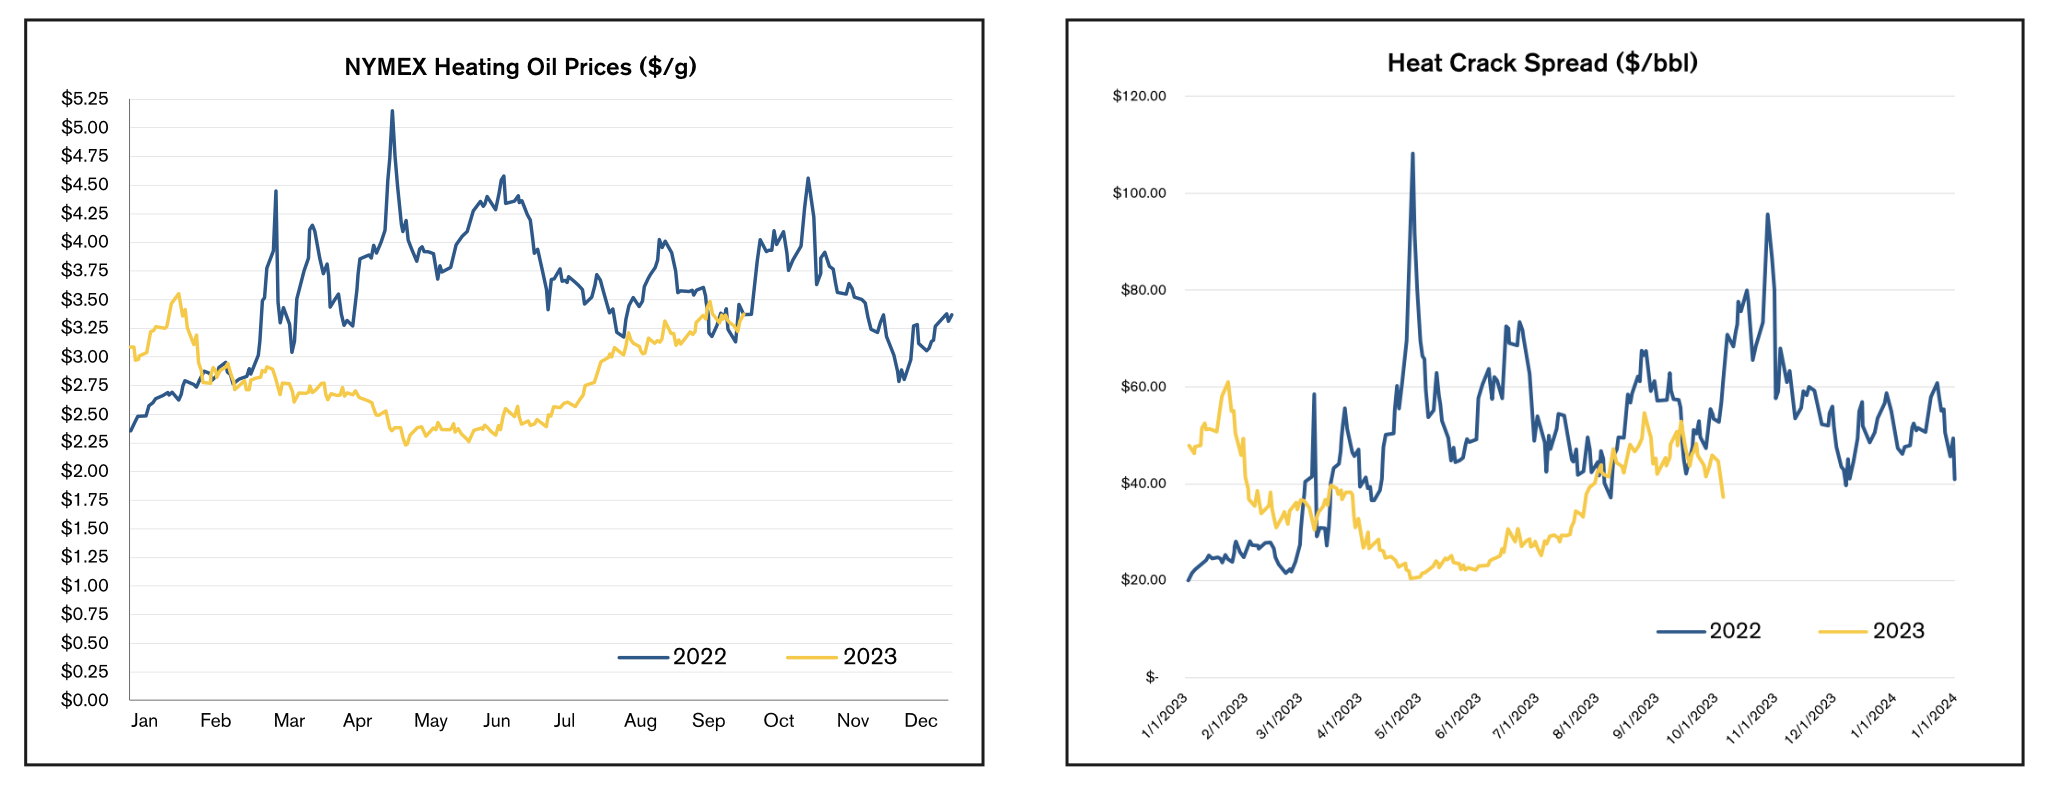
U.S. distillate production averaged 4.87mb/d during the stock building season from April through September this year, down from 5.01mb/d during the same period last year. The heat crack averaged a strong $54.37/bbl during last year’s building season, whereas it fell to an average of $33.00/bbl this season, largely due to weakness in the spring and summer, whereas crack spreads blew out in the summer of 2022. In short, we can say that the heat crack did not and, as of this writing, was not providing as strong an incentive for refining activity this year as it did last year.
Helping to offset the weaker year-on-year production this building season were weaker net exports. Net exports averaged 1.27mb/d last year but slowed to 1.08mb/d this year. Similar to last year, Russia remains in the news, but the reasons for this and the situation has changed. Last September Russia was set to claim the annexation of four regions in Ukraine, the European Union had banned the maritime importation of crude oil and refined products from Russia, and the G7 was working on a (later implemented) price cap on Russian crude oil and refined products. Also in September were the explosions on the Nord Stream natural gas pipeline system from Russia to Europe. Following the blast, natural gas prices in both Europe and Asia rocketed higher, making a switch to fuel oil for power generation economically viable and increasing demand. This year, however, gas prices were much calmer with strong European storage levels. According to Gas Infrastructure Europe, European gas storage sites were over 96 percent full as of the latest data available in early October. Additionally, the market has had time to adapt to the Western sanctions against Russia, and prices have been exceeding the G7 price caps as sales are being insured and shipped by non-Western parties, thereby not running afoul of the sanctions. On the other hand, Russia was back in the news early this heating season due to the temporary imposition of a ban on fuel exports. The ban was progressively relaxed, but the government remained committed to preventing domestic Russian prices from rising too high this heating season.
The EIA calculates that NOAA data call for 3,465 population-weighted heating degree days in the US this winter (October through March), closely in-line with the 3,471 heating degree days that we saw in the 2022-2023 winter. Both were warmer than the previous 10-winter average, the most recent of which is 3,579 (3.2% higher than the projection for this winter). An El Niño weather pattern was in effect and expected to persist this winter. The latest long-range outlooks from the National Weather Service Climate Prediction Center saw higher chances for above-normal temperatures across the northern third of the country in both the November through January and December through February periods.
Cash market differentials were relatively tame early this October. New York Harbor ULSHO barge price differentials were at -12.75c/g, whereas they had jumped to +13.00c/g last year. Similarly, Harrisburg, Pennsylvania (+10.88c/g) and Portland, Maine (+16.67c/g) differentials were flat to slightly higher than in the summer, whereas they had shot up to +66.37c/g and +44.86c/g by the same point in 2022, and continued to surge in two waves, peaking at over $1.50/g in both markets in early November. How this winter will play out is anyone’s guess, but the low stock levels make it more likely we could see a blowout should there be heavy demand or supply shocks.
Dan Lothrop is Head Trader at over-the-counter derivatives company Northland Energy Trading LLC. He can be reached at 800-709-2949 or daniel@hedgesolutions.com.
The information provided in this market update is general market commentary provided solely for educational and informational purposes. The information was obtained from sources believed to be reliable, but we do not guarantee its accuracy. No statement within the update should be construed as a recommendation, solicitation or offer to buy or sell any futures or options on futures or to otherwise provide investment advice. Any use of the information provided in this update is at your own risk.
