
How you schedule your hedges has more impact than you might realize
With the 2023-2024 heating season drawing to a close, you are likely looking at your price program offerings for the 2024-2025 season. It can be tempting to try to time the market in order to offer a more desirable price than your competitors, perhaps by hedging larger volumes on what look like dips or waiting until the last minute. Or you might take the opposite tack and slowly, evenly, and methodically scale in your hedges. What does the data say is the best course to take?
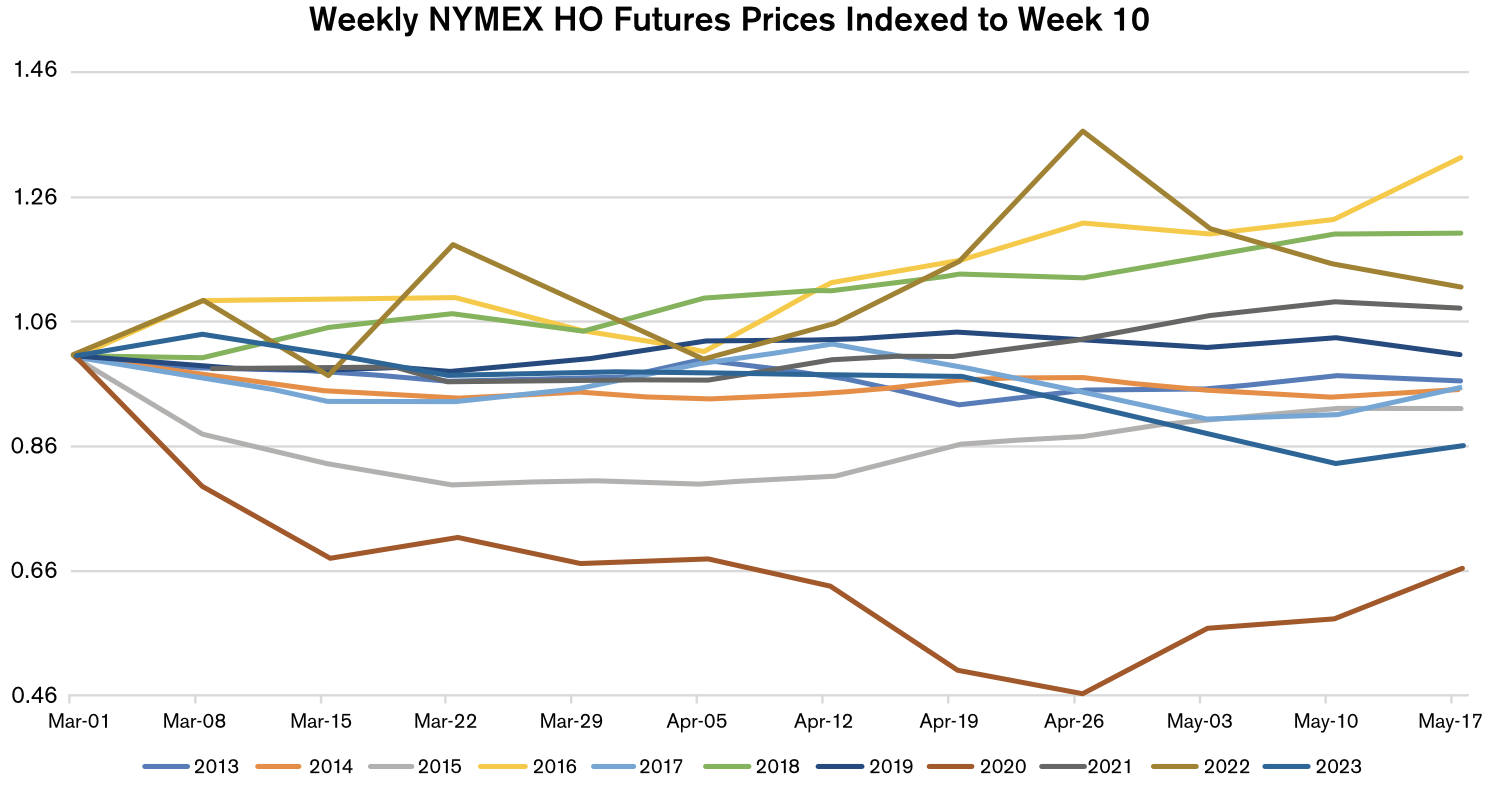
The lowest-price offering will of course depend on the path that prices take over the hedge scale-in period, and how your hedged volume lines up with those price movements. If we look at the chart of NYMEX ULSD (HO) futures prices indexed to the tenth week of the year, we can see that they can take varied paths, and that it would be quite dangerous to assume they will conform to a certain pattern. Again, trying to time the market is likely to be a fool’s errand.
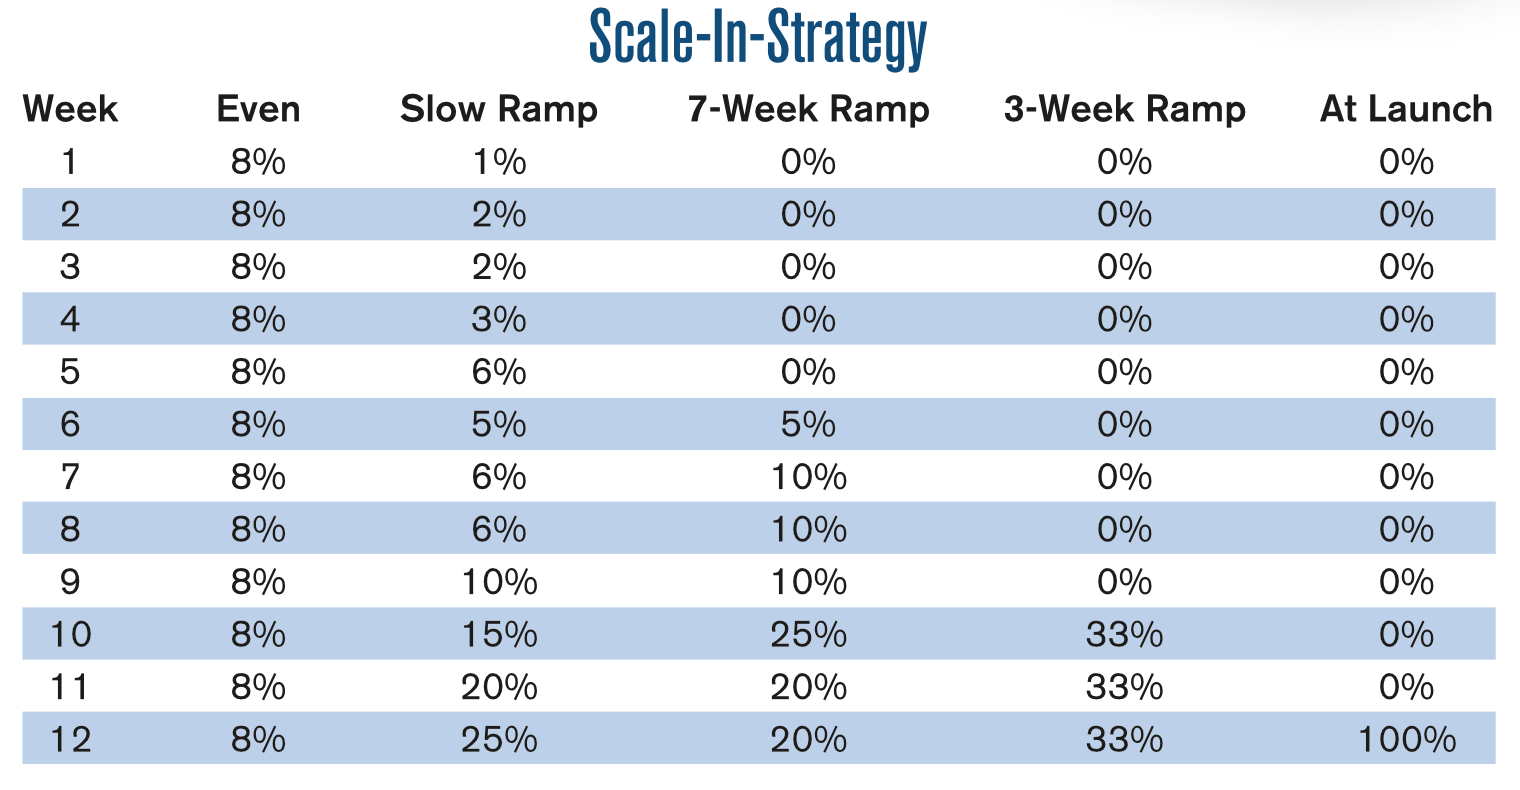
Every hedging season will be different, but Hedge Solutions has run the numbers for the past ten seasons to get a sense of how different strategies stack up. For each season, we look at a 12-week period leading up to launch, in this case in June. We calculate the volume-weighted average price that results from five hedging strategies: hedging evenly over the twelve weeks, a slow ramp, a seven-week ramp, a short three-week ramp, and finally hedging it all right at launch.
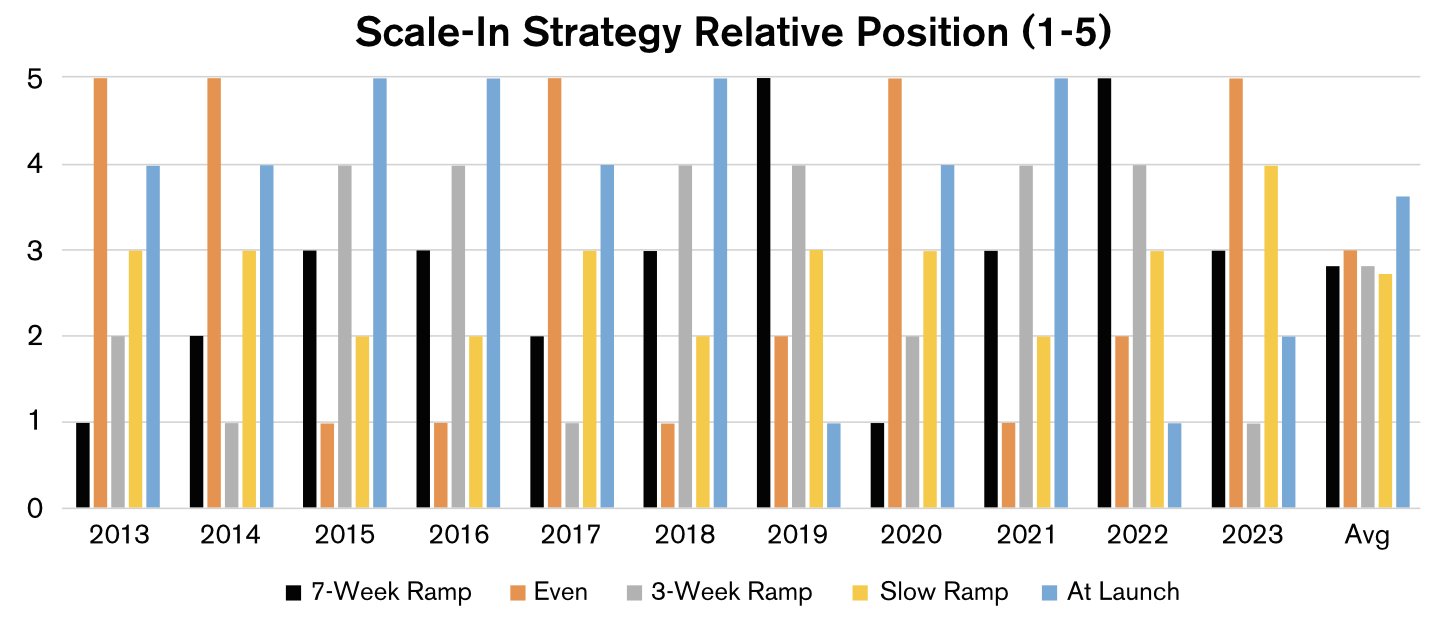
We then rank these ordinally, with the lowest number being best (lowest cost), and we see some patterns emerge. In the chart above, we can see that, over the past ten years, hedging right at launch has on average resulted in the worst result – the highest cost. The next worst result was achieved by doing the opposite, hedging evenly from March through May, leaving the three ramp scenarios as the top performers. In this data set, the Slow Ramp ever so slightly outperformed the 3-Week and 7-Week Ramp scenarios, which tied for second place. The difference among these is negligible. We achieved a similar result two years ago running the data for the 2011-2021 period. That being said, the 7-Week Ramp seems to be a good scenario to settle on, keeping us very much in the running the majority of the time and also representing a happy medium between the two low-performing extremes.
What did the launch prices look like over these last ten years? Looking at our preferred seven-week ramp, they varied quite significantly from as high as $3.94 in 2022 with the Russian invasion of Ukraine to as low as $0.87 in 2020 due to the pandemic, with an average of $2.19. At the end of February of this year, the front-month NYMEX HO price was about $2.67, but due to backwardation in the forward curve, the October through April heating degree day volume-weighted strike price was $2.46 – slightly above the 10-year average, but in line with last year. What prices would and will do between March and June is anyone’s guess. The strike price is only one component in the cap price hedging equation, however; the other being the option premium.
Option premiums are priced depending on a number of factors, including time value, the risk-free rate (representing an opportunity cost), perceptions about volatility, and the price of the underlying asset. From the start of the scale-in period in March to the end of it in late May, time value will fall slightly, but for options on futures for the upcoming winter, this is likely to be very much overshadowed by changes in implied volatility and the price of the underlying futures contract. In other words, an advantageous change in the option premium can quickly be negated by the change in the futures price or the rate at which the futures prices change. Here, too, we can see the logic of a scale-in ramp. The price of the underlying and the option premium are positively correlated, and we have already seen how the scale-in ramp helps us avoid the extremes from hedging equal volumes throughout the period (a straight average) and accepting the at-launch price. This applies to the option premium as well, not only through the price of the underlying prices but through implied volatility as well. Implied volatilities were low during the 2017, 2018, and 2019 hedging seasons, ranging from 23 to 28 percent, but were much higher at more than 40 percent in 2022 and 2023. As of late February of this year, implied volatility in options for the upcoming winter had come down to the low 30’s or high 20’s; resulting in lower option premiums! As with futures prices, we have no crystal ball letting us know how these will evolve over the hedging season – but we know that the data show that a scale-in ramp is likely to improve our chances of being in good shape relative to competitors.
Dan Lothrop is Head Trader at over-the-counter derivatives company Northland Energy Trading LLC. He can be reached at 800-709-2949 or daniel@hedgesolutions.com.
The information provided in this market update is general market commentary provided solely for educational and informational purposes. The information was obtained from sources believed to be reliable, but we do not guarantee its accuracy. No statement within the update should be construed as a recommendation, solicitation or offer to buy or sell any futures or options on futures or to otherwise provide investment advice. Any use of the information provided in this update is at your own risk.
