
Strong stock levels could make for smooth sailing this heating season
Basis risks were looking relatively high at the start of the heating season last year, with East Coast distillate stockpiles below their weekly five-year range in the week ended September 27, 2019, and with strong exports on the demand side and the loss of regional production from the shuttered Philadelphia Energy Solutions (PES) refinery on the supply side of the equation. We outlined these factors and their impact on our PADD 1 inventory model in “Basis Blowout Ahead?” from the November-December 2019 issue of this magazine.
While one factor remains constant — the PES refinery is shut, and the site has been sold to Hilco Redevelopment Partners (Editor’s note: see “End of an Era” from this issue) — other factors paint a starkly different picture. Weak exports and depressed domestic demand amid the pandemic, even as production fell with weak refinery margins, left stock levels very healthy in late September.
East Coast distillate stock levels were relatively weak near the end of the 2019-2020 heating season. Near the end of that season, on March 27, regional inventories stood at 122.25 million barrels (mb), which was 4.6 percent (5.92mb) below the same week in 2019 and 12.7 percent (17.74mb) below their five-year average for the reporting week according to data from the Energy Information Administration’s Weekly Petroleum Status Report. Then, the coronavirus pandemic struck and demand tumbled amid lockdowns.
Skydiving Demand
U.S. implied demand, as measured by product supplied, crashed from 3.91 million barrels per day (mb/d) to just 2.76mb/d by the week ended April 10 – a 29.4 percent (1.15mb/d) drop. Although the weekly series is jumpy — with drops to fresh weekly five-year lows in late May, early and mid-July, mid-August, and most recently in mid-September amid Hurricane Laura — the general trend has been up toward the weekly five-year average, and distillate demand has recovered to a much greater extent than has gasoline demand.
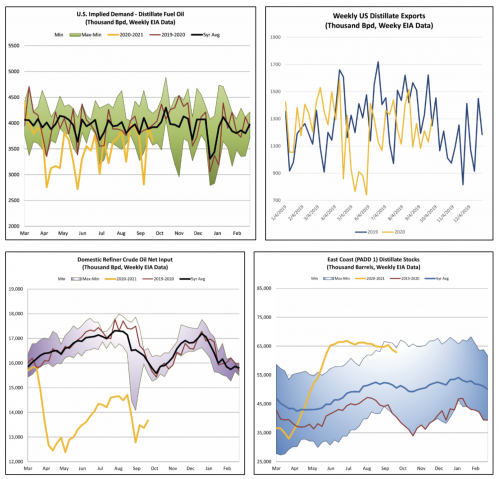
Implied demand averaged 3.35mb/d in the three months from April through June, and 3.57mb/d from July through September, and demand during the week ended September 18 exceeded both the five-year average for the week as well as demand during the same week last year. However, the outlook for demand remains highly uncertain, with downside risks apparent in rising case counts in a number of U.S. states as of this writing in late September. Both the trend in cases and the political will at various levels of government to impose restrictions are likely to determine the future path of domestic demand.
Whereas U.S. distillate implied demand has recovered to a large extent, foreign demand for U.S. distillate production remained weak as of this writing. Exports had been running stronger than last year during the first quarter, averaging 1.32mb/d versus 1.15mb/d last year, but there was a sharp drop in exports from mid-April through late May. For those two months, exports averaged just 1.03mb/d compared to 1.39mb/d last year. Exports continued to run at a deficit to last year as of this writing, with an average of 1.18mb/d for the month of September to date, compared to a 1.35mb/d average for last September. In late September of this year, the global coronavirus death toll topped one million, with over 33.3 million infections. Meanwhile, rising concerns over increased case counts in places that imposed lockdowns earlier this year had managed to keep a lid on the spread.
Skyrocketing Stocks
On the other side of the supply-demand equation, U.S. producers (refiners) reacted to the rapidly changing economics. In the spring, refining margins fell sharply and net crude oil input into refineries collapsed. For context, Hurricane Harvey slammed into the Gulf Coast in August of 2017 and dropped refinery runs from 17.73mb/d to 14.47mb/d in the week ended September 1. This year’s pandemic saw runs hit lows of 12.46mb/d in the April 17 week and just 12.38mb/d in the week ended May 8. More recently, runs averaged just 13.33mb/d in September, compared to 16.68mb/d last year – a 21 percent drop.
Demand destruction overshadowed the drop in production. With help from a contango structure in the NYMEX ULSD (HO) futures forward curve that developed as near-month contract futures prices fell more sharply than outer months — providing economic incentives for storage — distillate stockpiles grew very rapidly this year. On the East Coast, stock levels skyrocketed from 33.0mb in late March to 65.23mb by early June — far above their weekly five-year average — and remained above this range through September. As of the week ended September 25, stocks at 62.85mb were 12.34mb or 24.4 percent above their five-year average and 22.4mb or 55.5 percent above last year’s levels.
Making the Model
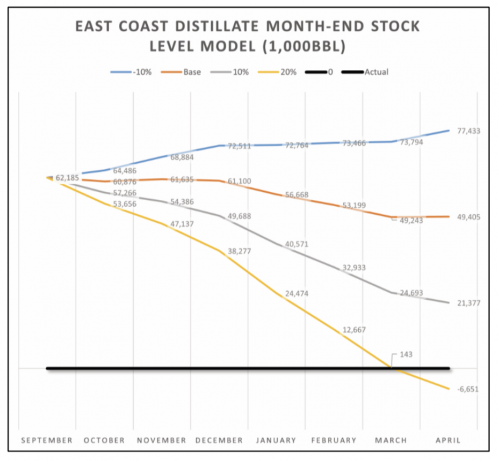
With such strong stock levels, there looks to be a hefty cushion to ward off price spikes in the cash market. In order to quantify and visualize this, Hedge Solutions updates a model of the East Coast distillate market each year ahead of the heating season. We take monthly five-year averages of regional production, net imports into the region, flows by pipeline, barge, and rail both in and out, and implied demand. In order to accommodate for the loss of production from the shuttered 350kb/d Philadelphia Energy Solutions refinery, monthly five-year averages for four of the past five seasons were reduced by estimated distillate output.
The latest stock data we had was for the week ended September 25, and as the five-year average change in inventories for the week ended closest to October 2 is minus 669,000 barrels, we assumed inventories would be 62.185mb as of October 2. We then applied the monthly five-year average factors to create a baseline path for inventories. Finally, we stressed implied demand up by 10 percent and 20 percent, and down by 10 percent, in order to simulate colder or warmer than baseline winters. In all but the 20 percent stronger demand scenario, there was no threat to stock levels, and in that scenario the threat came only at the tail end of the season.
This is a static model, and in reality various factors would respond to changes in absolute and relative prices, but it is helpful in visualizing basis risks, which, as of this writing, appeared quite low.
The information provided in this market update is general market commentary provided solely for educational and informational purposes. The information was obtained from sources believed to be reliable, but we do not guarantee its accuracy. No statement within the update should be construed as a recommendation, solicitation or offer to buy or sell any futures or options on futures or to otherwise provide investment advice. Any use of the information provided in this update is at your own risk.
Dan Lothrop is Head Trader at over-the-counter derivatives company Northland Energy Trading, LLC. He can be reached at 800-709-2949 or daniel@hedgesolutions.com.
