
As demand returns, RIN spikes blow out ULSD-ULSHO spread
The summer driving season was set to kick off shortly as of this writing in early May, and this summer is shaping up to be quite different from last summer in terms of refined product demand. U.S. vaccine distribution is moving along, the economy is growing — although April saw an alarming rise in the unemployment rate and far fewer than expected non-farm payroll additions — and implied demand for gasoline, distillates, and propane/propylene recovered to their weekly five-year averages. There are also some signs of life in jet fuel demand.
How did we get here, what does this mean for distillate stock levels moving forward, and what does this suggest about cash market differentials this winter?
_______________
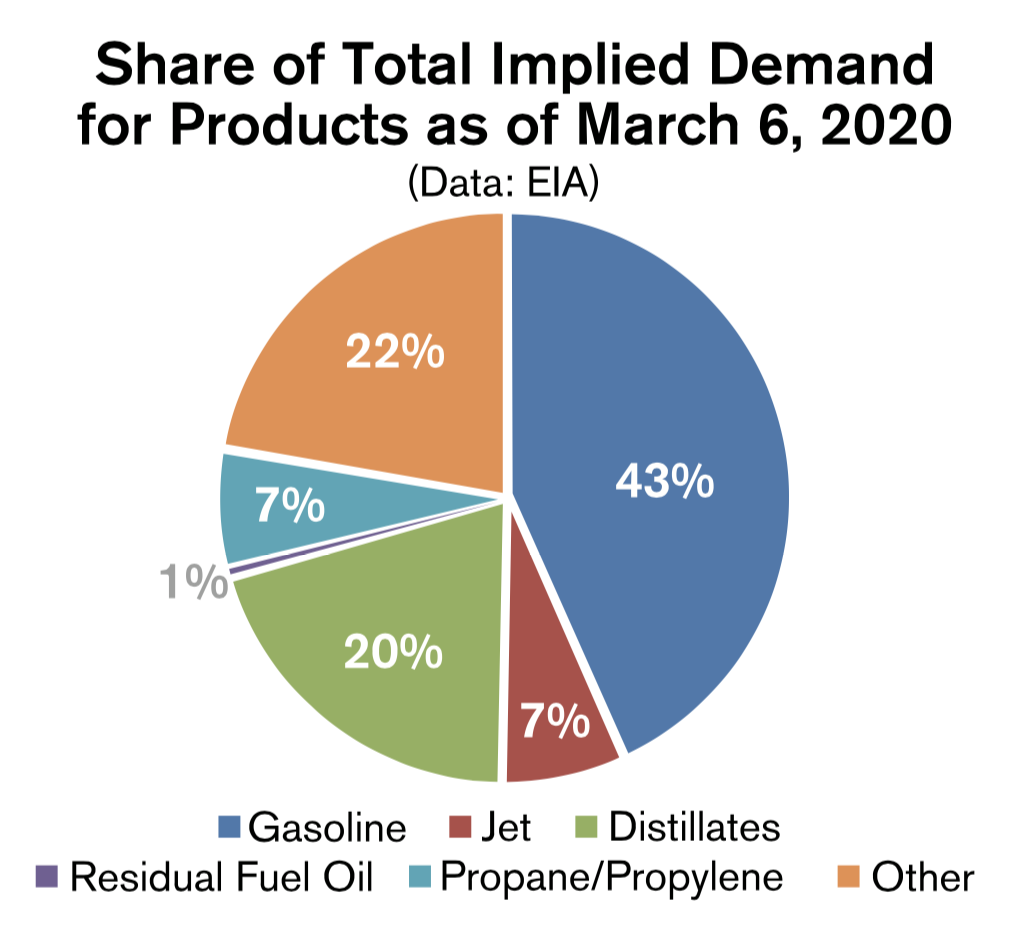
Implied demand for petroleum products, as measured by product supplied, was 21.86 million barrels per day (mb/d) as of the March 6, 2020 reporting week, according to data from the Energy Information Administration (EIA). At that time, gasoline made up 43 percent of total demand, distillates accounted for 20 percent, and jet fuel and propane/propylene each accounted for 7 percent. The 3:2:1 ICE Brent crack spread, an indicator for refinery margins, was $39.04 per barrel (bbl). The Brent to NYMEX RBOB crack spread was $13.07, and the Brent to NYMEX ULSD (HO) crack spread was $12.91.
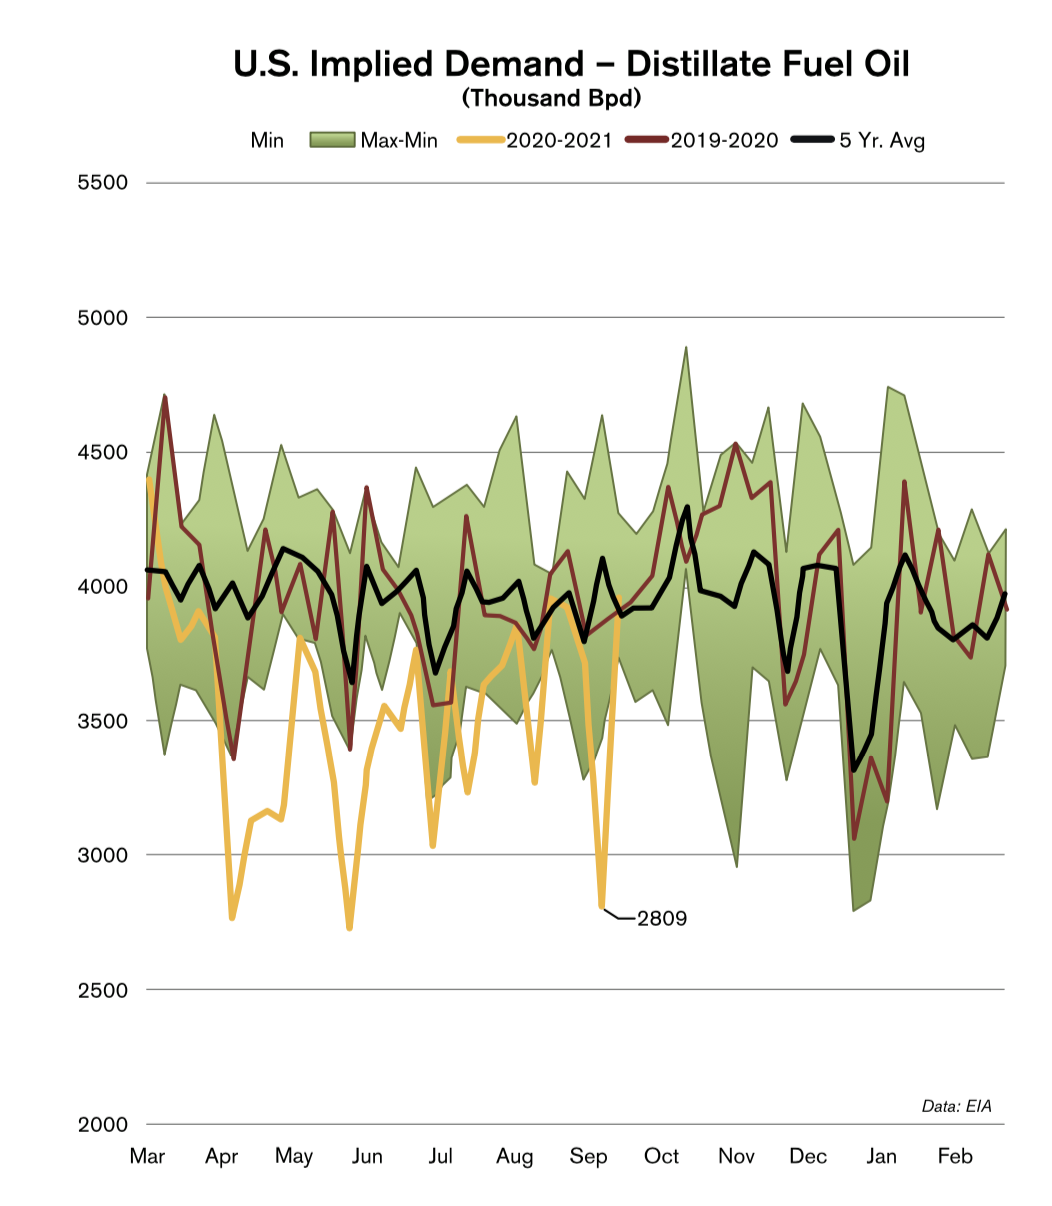
Then, lockdowns across the country in response to the coronavirus pandemic sent total product demand tumbling down 37 percent or 8.06mb lower to 13.80mb by the week ended April 10, 2020. In percentage terms, jet fuel demand was the hardest hit as air travel plummeted. Jet demand fell 70 percent, whereas gasoline demand dropped 46 percent and distillate demand fell 37 percent. In volumetric terms, gasoline saw the largest decline at 4.37mb/d, followed by distillates at 1.64mb/d and then jet fuel at 1.10mb/d.
On the supply side of the equation, refiners responded to economics. The 3:2:1 Brent crack tumbled down from $39.04 to -$3.82 on March 23, and the gas crack fell from $13.07 to -$9.73, but the diesel crack widened from $12.91 to $15.65 over the same period. As much as they could, refiners switched yields toward diesel, and as jet fuel demand was quite limited, this was blended into the pool as well. With weak demand, refinery runs still had to fall, of course, and input of crude oil into refineries fell 3.24mb/d or 21 percent to 12.46mb/d from March 6 to April 17. East Coast runs fell 21 percent or 142 thousand barrels per day (kb/d) and runs by Midwestern refiners fell 26 percent or 948kb/d, while complex Gulf Coast refiners were better able to weather the storm. PADD 3 runs fell by 13 percent or 1.14mb/d.
Distillate demand, supported by logistics, construction, and manufacturing demand, recovered to near its weekly five-year average by September and October, but gasoline demand took until this spring before it exceeded the five-year average for multiple consecutive weeks, as virus-related restrictions and remote work weighed. By April 30 of this year, total products demand had recovered by 90 percent, with both gasoline and distillate demand at 94 percent of their March 6, 2020 rate. Jet fuel demand, however, had only recovered to 69 percent.
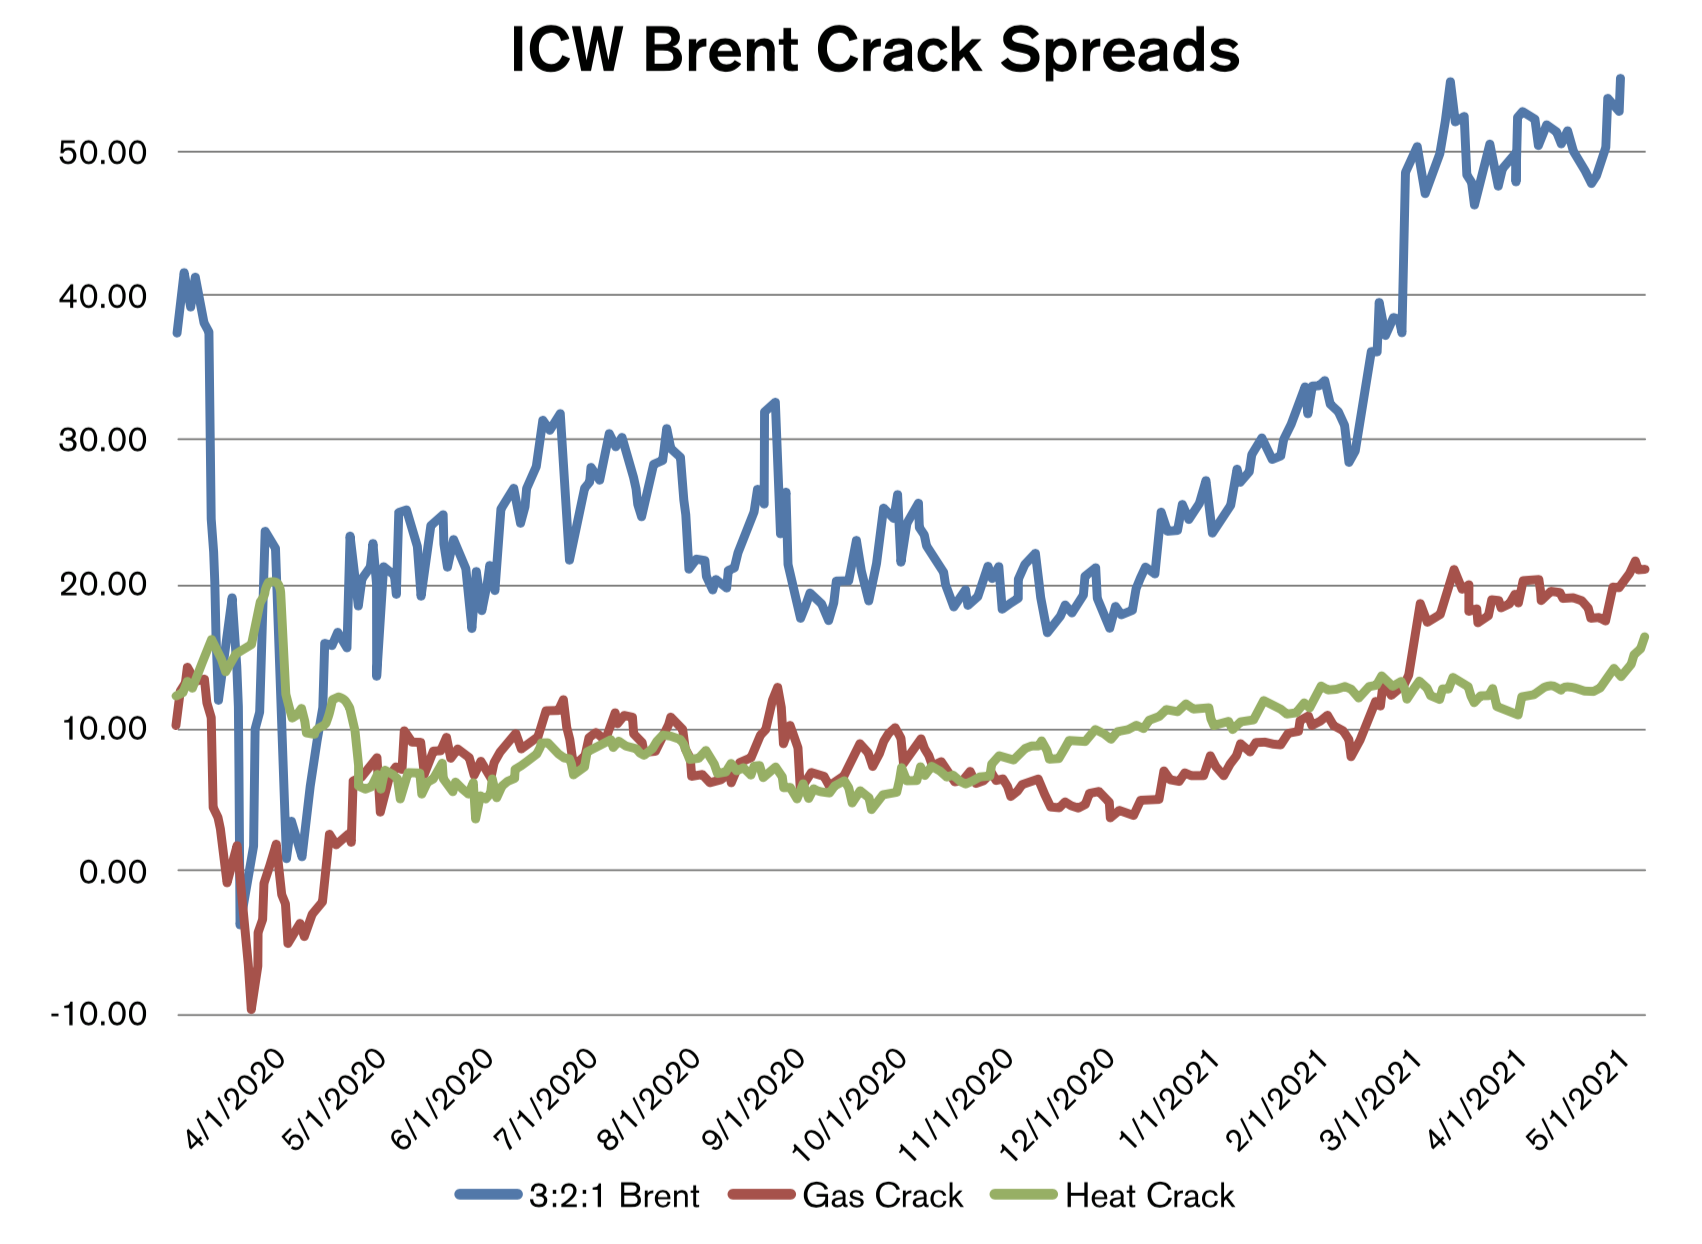
At the time of this writing in early May, refining economics had improved along with the recovery in demand. The 3:2:1 Brent crack had hit $59.83/bbl by May 10, and both the gasoline crack ($21.58) and diesel crack ($16.66) were stronger year-on-year as well. Refinery runs recovered to 15.24mb/d by April 30, which is 97 percent of where they stood on March 6, 2020. East Coast runs had recovered 94 percent, Midwest runs by 96 percent, and Gulf Coast runs were up 101 percent. There were fears that there could be consolidation and a loss of U.S. refining capacity due to the pandemic. While some operable crude oil distillation capacity was lost, it was limited at 0.67mb/d and centered on the East Coast due to the decommissioning of the Philadelphia Energy Solutions refinery. Total U.S. capacity was still 96 percent of where it was last spring, at 18.14mb/d.
U.S. distillate stock levels stood at 136.15mb as of the April 30 reporting week, with East Coast stocks at 41.45mb. These were 2.2 percent and 9.2 percent below their respective five-year averages for the reporting week. Where were stocks likely to go from there?
__________________
Stronger refining economics and gasoline demand heading into the gasoline season were a supportive factor for inventories, as it is only possible to switch yields so much, and any increase in refinery runs to meet gasoline demand would bring along increased distillate production. The lag in the jet fuel demand recovery was also supportive, keeping some jet production in the broader distillate pool. Should air travel pick up significantly over the coming months, this blending would slow, and distillate stocks could build more slowly than otherwise. This could take time, however, and some analyses, including recent work by Refinitiv, suggest jet fuel demand may not reach its pre-pandemic peak even over the next nine years.
Also helpful for distillate stocks is that, unfortunately, foreign demand centers have been hit by the coronavirus, with a surge in infections this spring while vaccine availability is limited in many countries. U.S. distillate exports averaged about 0.90mb/d from January through April of this year, compared to 1.30mb/d during the same period last year.
Should foreign demand for U.S. distillates recover, or U.S. jet fuel demand start to pick up, this could put additional pressure on U.S. distillate stocks that were already falling counter-seasonally in April. These two factors could move together, as an improved coronavirus situation abroad could lead to both increased air travel to a given destination, as well as demand for U.S. exports. The NYMEX HO (ULSD) futures forward curve was fairly flat in early May, providing little economic incentive for storage. With these factors and below-average stocks, basis risk for the upcoming heating season might look to be near to slightly above normal.
The shutdown of Colonial Pipeline’s main product lines from the Gulf Coast to the East Coast due to a ransomware cyberattack could have put additional downward pressure on PADD 1 stockpiles. There is, however, plenty of time for distillate inventories to turn back north and recover to five-year average levels. Still, this might lead us to expect that fixed differential offers for next season might not be all that attractive. However, an additional outside factor may be at play – renewables.
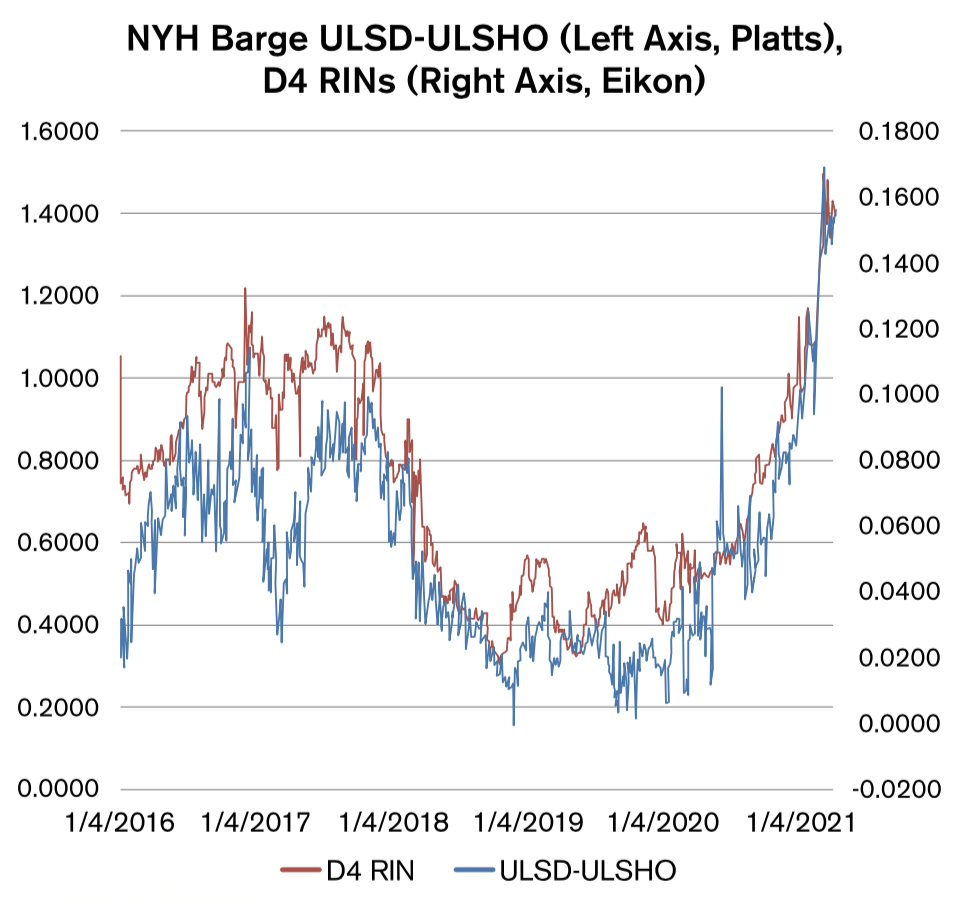
At New York Harbor, ULSD barges, which carry on-road diesel, typically trade at a premium to ULSHO barges, as ULSHO is off-road and therefore not subject to the Renewable Volume Obligations under the Renewable Fuel Standard. Because of this, the spread is highly positively correlated with the value of D4 (Biodiesel) Renewable Identification Numbers, or RINs. The Trump administration granted a number of small refinery exemptions to larger refiners, a process which the current administration is not expected to continue.
Along with strong feedstock prices, we have seen RIN prices hit record levels, and the ULSD-ULSHO spread has blown out. Whereas the spread averaged 2.24 cents per gallon (c/g) with D4 RINs averaging 50.71 cents in the first quarter of 2020, the spread averaged 12.28 c/g with RINs at $1.1841 during the first quarter of this year and widened further to 20.50c/g as of May 10. Such a steep discount for ULSHO versus ULSD could be enabling wholesalers to offer relatively attractive differentials to NYMEX for this winter, as NYMEX futures are ULSD-spec.
Dan Lothrop is Head Trader at over-the-counter derivatives company Northland Energy Trading LLC. He can be reached at 800-709-2949 or daniel@hedgesolutions.com.
The information provided in this market update is general market commentary provided solely for educational and informational purposes. The information was obtained from sources believed to be reliable, but we do not guarantee its accuracy. No statement within the update should be construed as a recommendation, solicitation or offer to buy or sell any futures or options on futures or to otherwise provide investment advice. Any use of the information provided in this update is at your own risk.
