
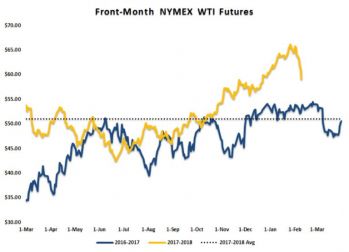
Crude oil and refined products futures rallied sharply throughout the second half of 2017 and much of January 2018, with front-month NYMEX WTI crude oil futures rising from a low of $42.53/bbl on June 21 to a high of $65.61/bbl on January 24. What were some of the factors at play behind this 54.3% rally?
Stock Market Indexes
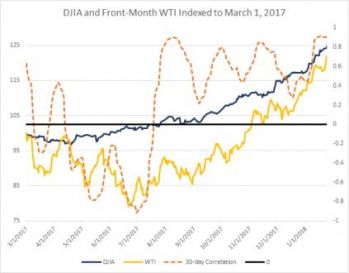
Crude oil futures tend to be positively correlated with stock market indexes, as the latter are positively associated with economic growth, and economic growth leads to increased oil demand growth. This correlation, however, does not always hold true. For much of early 2017, the trailing 30-day correlation between the Dow Jones Industrial Average and front-month NYMEX WTI crude oil futures was negative, as crude prices weakened while domestic equities trended higher. The 30-day trailing correlation averaged a negative 39.7% from March 9, 2017 through July 18, 2017. The US stock market continued to rally, amid upbeat global economic data and forecasts, and crude futures later locked back on to a positive correlation with equities. From July 19, 2017, through January 24, 2018, the average was a positive 62.5% and as high as 90.9% on January 24, as the two moved in the same direction.
US Dollar Value
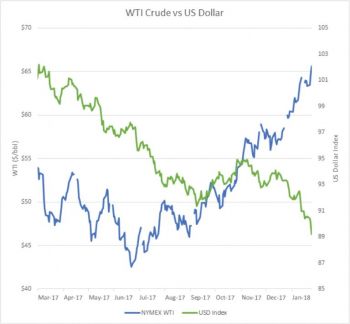 Crude oil futures and the US dollar tend to be negatively correlated, as oil futures are denominated in US dollars. Thus, if the US dollar gains value relative to other currencies, the nominal crude oil price must fall in order to keep its real value constant. As with the crude-equity correlation, this negative correlation is not always visible in the data. From early March through much of June of last year, the dollar index (the indexed value of the US dollar against a basket of currencies) was falling even as WTI crude futures prices were falling as well. The correlation reversed in late June and largely remained negative as the US dollar sold off, and as crude futures prices rallied.
Oil Market Fundamentals
 Along with the rally in equities and the sell-off in the US dollar, domestic and global crude oil market fundamentals appear to have underpinned the recent rally. In terms of foreign sources of price support, the global output cut agreement between OPEC, Russia, and other non-OPEC partners is, of course, a highlight. Russia has achieved a strong compliance rate — having maintained a rate of production that is 0.3mb/d lower than the October 2016 reference level for the final three quarters of 2017 — and this has continued in early 2018. As for OPEC, compliance among obligated parties — those with a binding output ceiling — averaged 91%, according to this author’s calculations (which use the latest revisions of historical data from secondary sources for all historical months, presented in the monthly report from OPEC, including the October 2016 reference level). Obligated party compliance hit a high of 124% in January. Strong compliance has been in large part helped by the troubled oil sector in Venezuela, as output has dropped from 2.07mb/d in October 2017 to just 1.60mb/d as of January 2018. However, overall OPEC output was only 0.79mb/d lower in January than it was in October 2016, short of the 1.16mb/d target cut, due to increased Libyan, Nigerian, Angolan, and Iranian oil production. The first two countries agreed in late 2017 to limit output to a combined 2.8mb/d, and secondary sources estimate that combined Libyan and Nigerian output in December and January was just shy of this ceiling. Nevertheless, strong compliance among Saudi Arabia and its Gulf allies, along with strong compliance from Russia, have helped to cut global inventories. The Paris-based International Energy Agency, in its January Oil Market Report, estimated (based on preliminary data) that OECD commercial liquid fuel inventories fell to 42.7mb in December, their fifth consecutive monthly decline. The US accounted for some of this decline, amid unusually strong refining activity.
As mentioned in the October 2017 edition of Oil & Energy, crack spreads (a proxy for refining margins) blew out amid Hurricane Harvey, and 3:2:1 WTI crack spreads remained elevated year-on-year through late January. Refinery runs, particularly on the Gulf Coast, were at or (mostly) well above the five-year range in weekly data from the Energy Information Administration from late September through the end of January, as refiners responded to this economic incentive. With stronger domestic demand for crude oil, US commercial inventories fell from about 474mb in mid-September to a low of 412mb in early January, with the final six or seven weeks of draws being counter-seasonal according to the five-year average. It was not only domestic demand helping pull down inventories, however, as exports averaged over 1.47mb/d for the period between the September 22, 2017 and January 26, 2018 reporting weeks — a sharp increase from an average of 0.52mb/d during the prior year period.
Finally, amid all the factors above, speculators put on very large net long positions in crude oil and refined products futures and options. Reuters’ John Kemp reports that the managed money net long position in WTI hit a record 461 million barrels in the week ended December 26, 2017, according to the Commitment of Traders Report from the Commodity Futures Trading Commission (CFTC). The same group amassed a record net long position of 92mb in heating oil futures and options the following reporting week (January 2). Whereas it typically takes some time to amass large net long positions, liquidation can occur much more quickly, leading to the old adage that “markets rise like an escalator, but fall like an elevator.” Indeed, this was evident in the early February sell-off.
Looking Ahead
Will prices continue to rise? One major headwind is that price strength encourages rising production. OPEC, in its February Oil Market Report, pushed back its predicted timing for a balancing of the oil market to late this year, due to stronger output predictions for the US and other non-OPEC countries. US crude oil production, according to EIA data, topped 10mb/d in the week ended February 2, a 1.27mb increase from the same week last year. The agency, in its February Short-Term Energy Outlook, said it expects US oil production will average 10.6mb/d this year — a new record annual average — rising to 11.2mb/d next year.
The information provided in this market update is general market commentary provided solely for educational and informational purposes. The information was obtained from sources believed to be reliable, but we do not guarantee its accuracy. No statement within the update should be construed as a recommendation, solicitation or offer to buy or sell any futures or options on futures or to otherwise provide investment advice. Any use of the information provided in this update is at your own risk.
