A weak La Niña system could bring lead to heavier snowfall in the northernmost areas
As summer comes to an end, we can take an early look at the forecasted weather pattern across the Northern Hemisphere as well as what the El Niño Southern Oscillation (ENSO) will present.
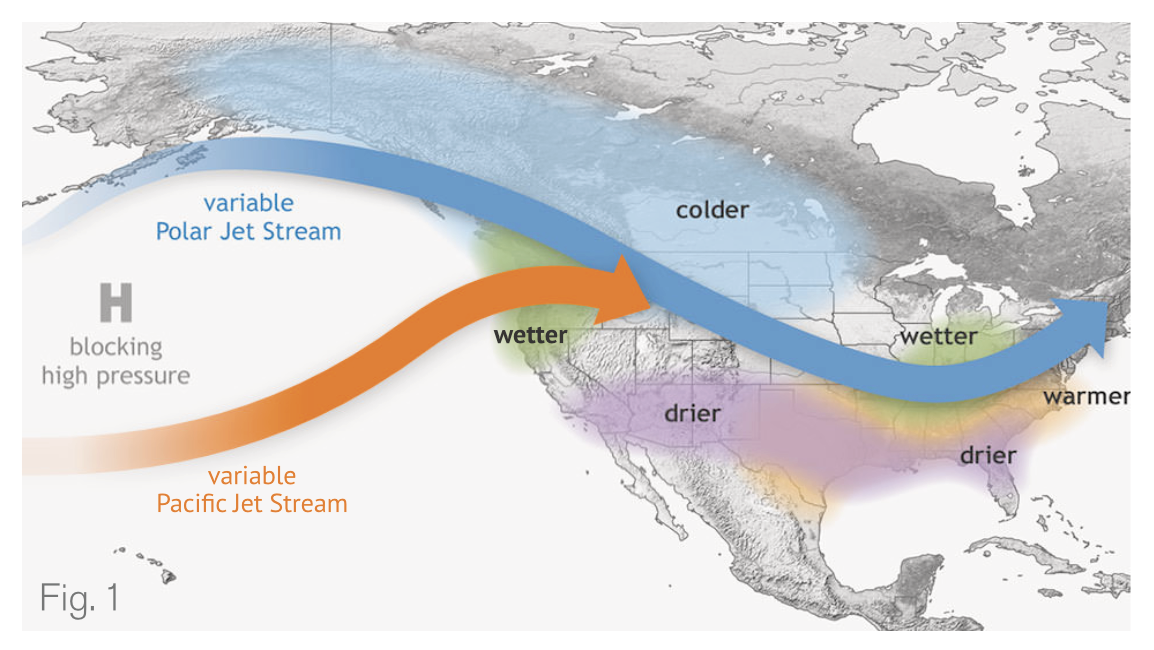
What we are currently seeing in the seasonal forecast guidance for the upcoming winter is a La Niña continuing to grow and expand westward along the equator in the Eastern and Central Pacific, a lot of mid-latitude upper-level ridging, and lower than normal upper-level pressure across the higher latitudes, particularly across Central and Eastern Canada. The La Niña will likely be on the weaker side. Ocean temperatures outside of the La Niña regions are overall forecasted to be well above normal for much of the planet through the winter. Some of the bigger drivers of the ocean temperature forecast that have a strong correlation to winter in the US include the Pacific Decadal Oscillation (PDO) and the Atlantic Multidecadal Oscillation (AMO). Both of these are currently looking to be positive through the winter and into the early spring. Those are both signals for a warmer than normal winter across the Continental United States. The graphic above (Fig. 1) shows what a “typical” La Niña pattern brings to the Northern Hemisphere.
As for the Madden Jullian Oscillation (MJO), it is currently looking to favor being in the warmer phases for most of the winter across the Western Pacific, given forecasted ocean temperature anomalies. Sudden Stratospheric Warming is tough to forecast several months in advance, but some is possible. However, it doesn’t guarantee any sustained colder-than-normal temperatures. We believe there will be a few rather transient pulses of colder-than-normal weather across the Northeast, but no sustained periods of abnormal cold.
Highlights for Winter 2024-2025
- The current oncoming La Niña in the Eastern Pacific Ocean likely sticks with us through the winter; though likely being a weaker La Niña.
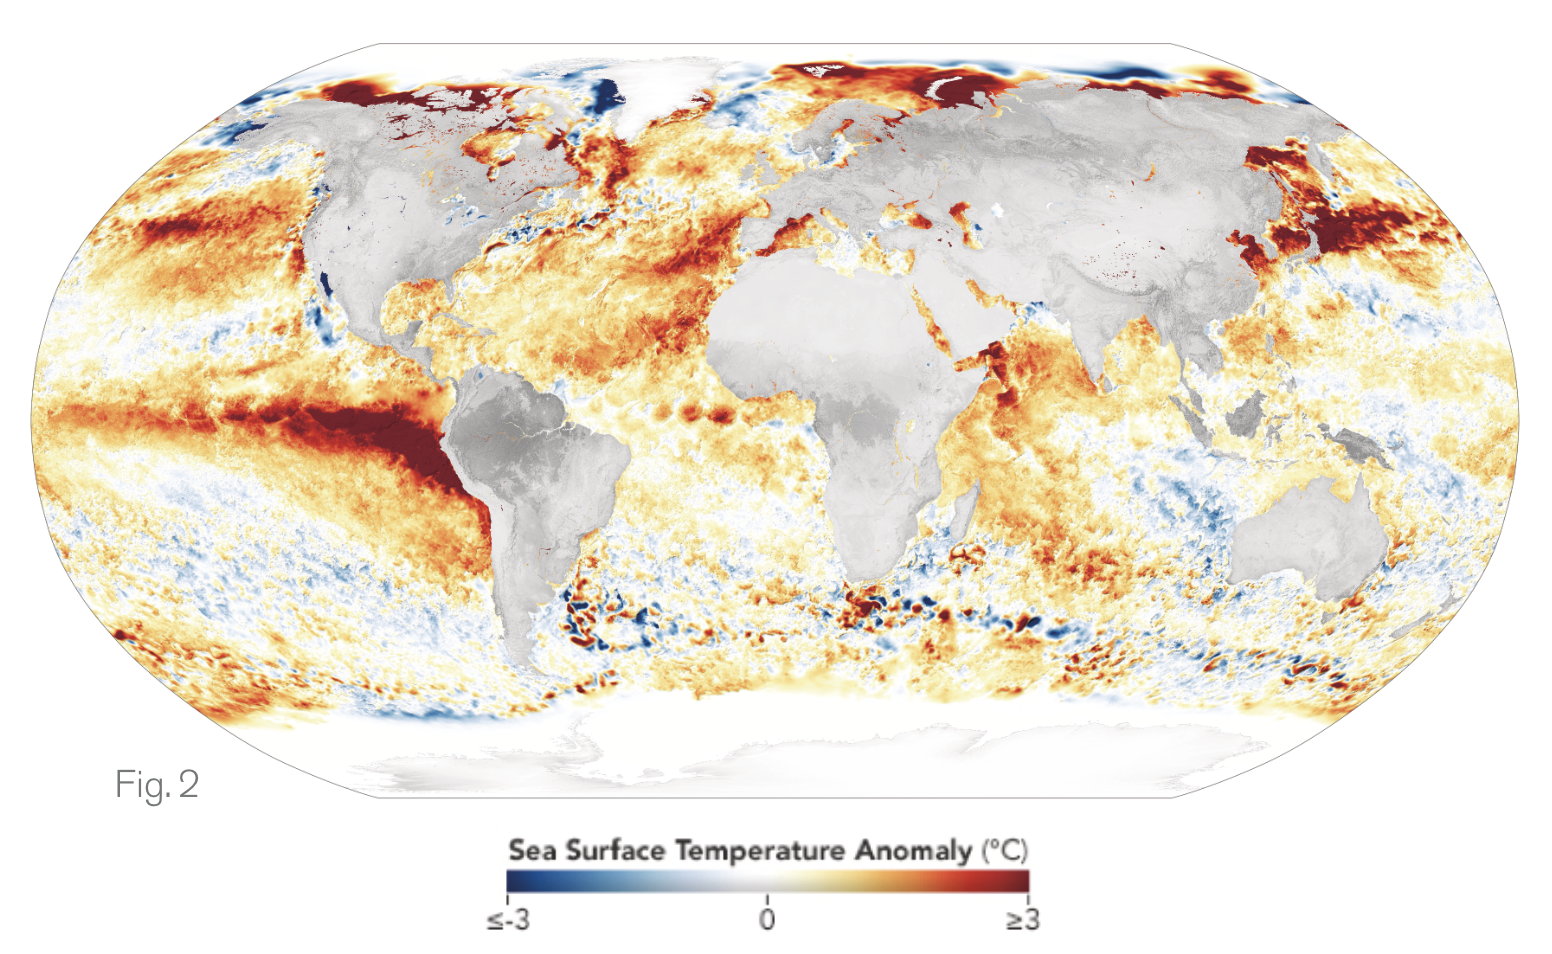
- Above average ocean temperatures globally for the most part likely favor mostly above normal temperatures across much of North America. The following graphic illustrates (Fig. 2) just how warm the global ocean water temperatures are (as of Augusta 25).
- Precipitation potentially will be above normal in most of the Northeastern part of the country thanks to a potentially active storm track as well as higher atmospheric moisture content globally from the warmer-than-normal oceans (as well as lingering surplus water vapor from the Honga Tonga sub-marine volcano eruption from late 2021 into early 2022.)
- The Madden Jullian Oscillation (MJO) pattern in the tropics will favor above normal temperatures.
- Snowfall at or below normal for a majority of the region, the exception will be northern areas of New England and far Upstate New York which we feel will see higher than normal snowfall.
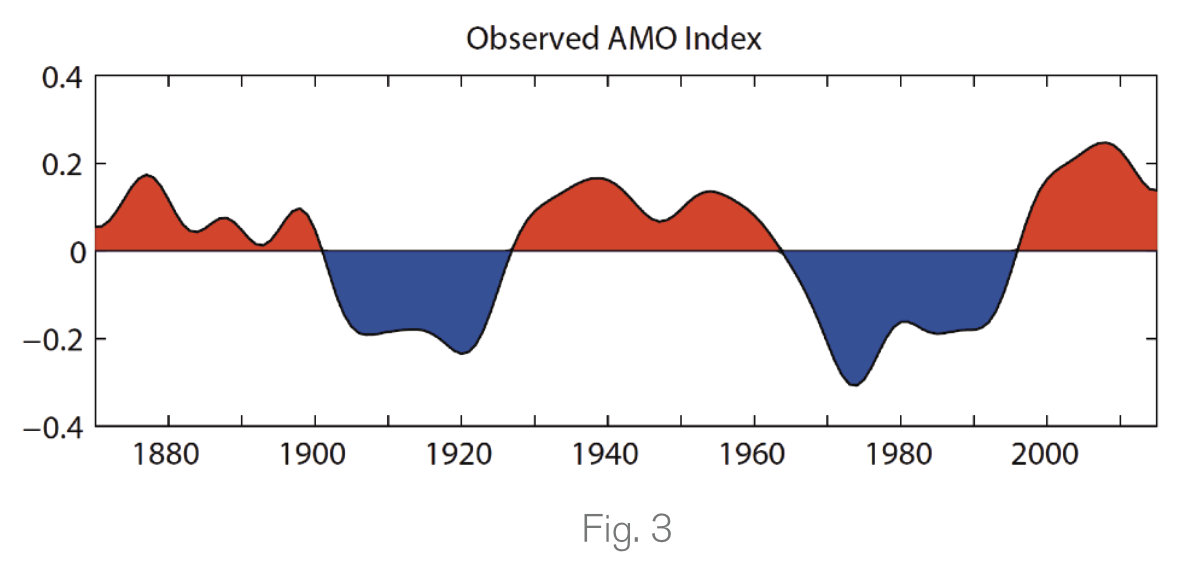
While there is no “magic” in long-range / seasonal forecasting, we are changing our approach a bit this year. We are in uncharted territory in terms of this warmer climate cycle, and we feel there are a few things contributing to this. First and foremost, we are in a natural cycle of warmth in the Atlantic, the Atlantic Meridional Oscillation, which has been the key driver of the warmer ocean water temperatures in our part of the world. This is a 25–30-year cycle which should continue to wane the next few years. See graphic on next page (Fig. 3).
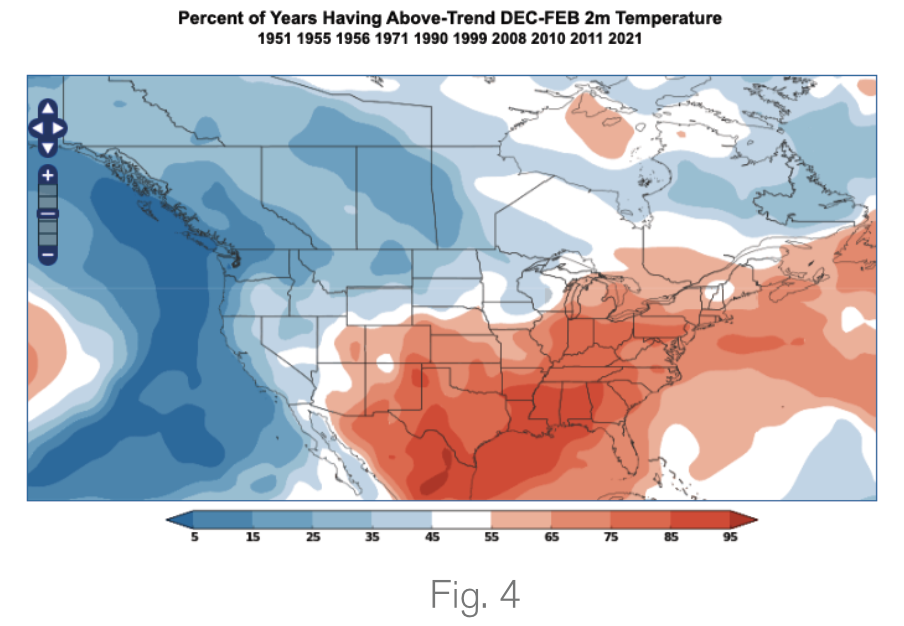
A similar cycle exists in the Pacific and we are currently in a negative Pacific Decadal Oscillation, which typically leads to warmer than normal temperatures as shown on next page (Fig. 4).
The third feature that has impacted global temperature and precipitation patterns was the eruption of the submarine volcano Hong Tonga in early 2022. This event pushed an estimated 150 megatons of water vapor into the stratosphere. Recall that water vapor is a greenhouse gas and has contributed to wetter and warmer conditions across many areas of the planet over the last two years. The effects of this massive injection of water vapor into the atmosphere should slowly wane in the next three-to-six months.
Our key takeaways for this winter are:
- We feel the winter as a whole will be warmer than normal.
- Pushes of transient cold will lead to some “normal” winter cold snaps.
- Snowfall will tend below normal – but parts of Upstate New York and Northern New England may very well see above normal snowfall totals.
A more detailed winter forecast has been sent to NEFI members with more of a breakdown on the winter including a month-by-month outlook of temperatures and snowfall.
As a reminder, our Energy Analysis Dashboard (EAD) offers NEFI members vast quantities of data with respect to heating degree day analysis and forecasts.
At each of the more than two hundred individual point locations, EAD users can select the last 30 days of observed HDDs and the cumulative sum of HDDs at each month of the year. Additionally, users can select the forecast highs/lows or cumulative HDDs from the SuperBlend Forecast System at each of these points. HDD forecasts also include the climatological normal (1990-2020) breakdown of HDDs over the ten-day period, which allows an enhanced assessment of how the forecast period relates to previous energy demand.
Feedback from NEFI members has been critical in fine-tuning our product offerings. As a result, we’ve already expanded the number of products for other members to benefit from and have additions planned for the 2024-2025 winter season. Some of these additions include:
- An option for EAD users to download a comma delimited file of forecast energy demand data for each state within NEFI’s footprint was implemented during the first half of winter 2023-2024. This option immediately became useful for members interested in integrating data into third party software.
- For the 2024-2025 winter season, climatological normal daily HDDs to each observed HDD window will be offered on the EAD. This allows members to reference how each window of actual heating demand stacks up to the normal amount of heating demand over the past 30 years.
- For the 2024-2025 winter season, forecast maps over NEFI’s footprint will also be included for all EAD users to utilize. Some NEFI members have previously expressed interest in viewing these forecasts presented spatially, in addition to more robust assessments on temperature departures in the forecast period. Products in this graphical package will include forecast highs/lows, forecast high/low departures, normal highs/lows, and forecast HDDs.
As always, we value your feedback and look forward to enhancing the value-added services we provide! Finally, a reminder, that the official winter outlook (a more detailed look and breakdown) was released in early October and we will be presenting this data in an online webinar for the membership later this autumn.
National Weather Forecasting is a private weather solutions provider offering accurate, point-specific forecasts as a free service to NEFI Members. Reports can be accessed through the Members Area at NEFI.com/members, and are sent out via email weekly. The team is available to answer any questions at weather@natweather.com.
