
Inflation, Recession Fears Moderate Price Pressures
Oil prices this June were a far cry from the sky-high prices we saw one year ago, following the Russian invasion of Ukraine and the imposition of Western sanctions. From a high of $124 per barrel (bbl) on June 14, 2022, front-month NYMEX WTI crude oil futures prices nearly halved, plunging to as low as $67/bbl on June 12, 2023. This tumble came despite a series of actions by OPEC+ countries to support the market. What were these steps and their impact, why were they not more impactful, and what is the outlook ahead?
Steps Taken by OPEC+ Countries
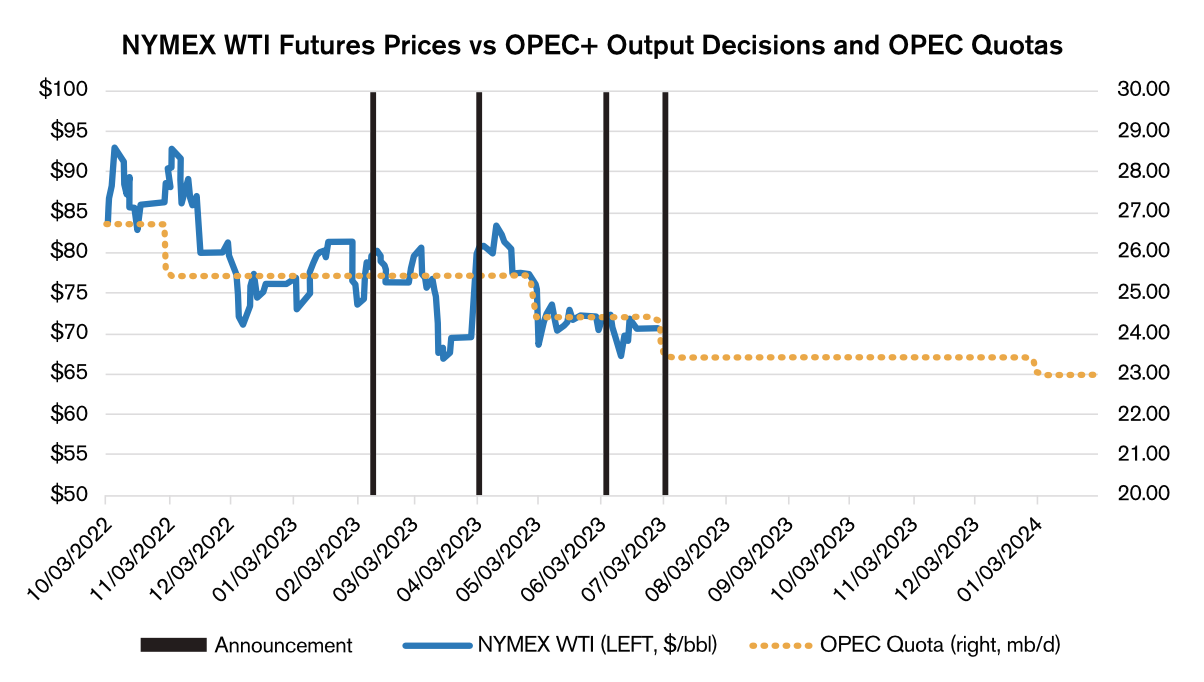
WTI crude oil prices had fallen to $84 by early October 2022. Despite pressure from the White House, OPEC+ announced a large output cut of 2mb/d. Prices held above $80 for some time, but then fell below this level in early December, hitting a low of $70. Oil prices were then rangebound between $73 and $83. In early February, Russia announced an oil output cut to a 9.5mb/d production level to take effect in March. Nevertheless, prices fell to as low as $64 the same month the cuts took effect. In early April, OPEC announced further output cuts totaling 1.16mb/d to be implemented in May, and prices rose to a high of $84 on April 12, only to come back down to below $70 by early May. Prices were then largely sideways between $67 and $73, prompting Saudi Arabia to pledge an output cut in June of nearly 1mb/d to take effect in July. The announcement came along with further OPEC+ output target reductions for 2024. Nevertheless, prices remained within the $67-$73/bbl range. In early July, Saudi Arabia and Russia announced additional measures. Saudi Arabia said it would extend its 1mb/d output cut into August, and Russia announced that it would be reducing crude oil exports by 0.5mb/d this month as well. Despite all these measures, WTI prices remained under $73 in the days following the announcement. What has been keeping prices down?
Economic Fears Dampen Demand Outlook
Likely the most impactful bearish factor in play over the last 10 months has been fear for the health of the global economy. As central banks around the world have worked to combat inflation, there have been fears over a recession and data have shown a slowdown. Composite Purchasing Manufacturers’ Indexes (PMI), which combine both service sector and manufacturing sector indicators, tend to be a fairly good guide to the direction of economic growth. The Composite PMI for the Eurozone (S&P Global) spent the third quarter of last year in contractionary territory, as did the indexes for the UK (CIPS/S&P Global) and China (Caixin). Things looked a little brighter earlier this year, with the Eurozone index averaging 52.6 through May, but falling back into contractionary territory in June. Indexes for the UK, Japan, Brazil, India, China, and the U.S. all fell in June, indicating growth slowed. In fact, the ISM Manufacturing Index for the U.S. hit its eighth month in contractionary territory in June, dragging the average of the manufacturing and service sector indexes (48.6) down to its weakest level in years.
The U.S. Federal Open Market Committee, the European Central Bank (ECB), the Bank of England, and many others have been working to fight stubborn, high inflation by raising interest rates. The Fed raised the target range for the federal funds rate to 5.00%-5.25% in May, and expectations were high for a further rate hike of 25 basis points in July, as of this writing ahead of the upcoming meeting of the Committee. The ECB has similarly indicated that future hikes are on the table. Higher interest rates tend to dampen two components of GDP that are most interest-sensitive: consumption and investment. Investments decline with a higher cost of capital, and consumers may put off larger purchases such as homes, automobiles, and vacations. Interestingly, stock market valuations have increased and the value of the U.S. dollar against a basket of currencies has decreased since last fall, which is inconsistent with what one might expect from unilateral U.S. monetary policy tightening. Moreover, while stock market indexes have strengthened and the dollar has weakened, neither the typical positive correlation between oil prices and equities nor the typical negative correlation between oil prices and the dollar have been evident.
U.S. Sales from the Strategic Petroleum Reserve (SPR)
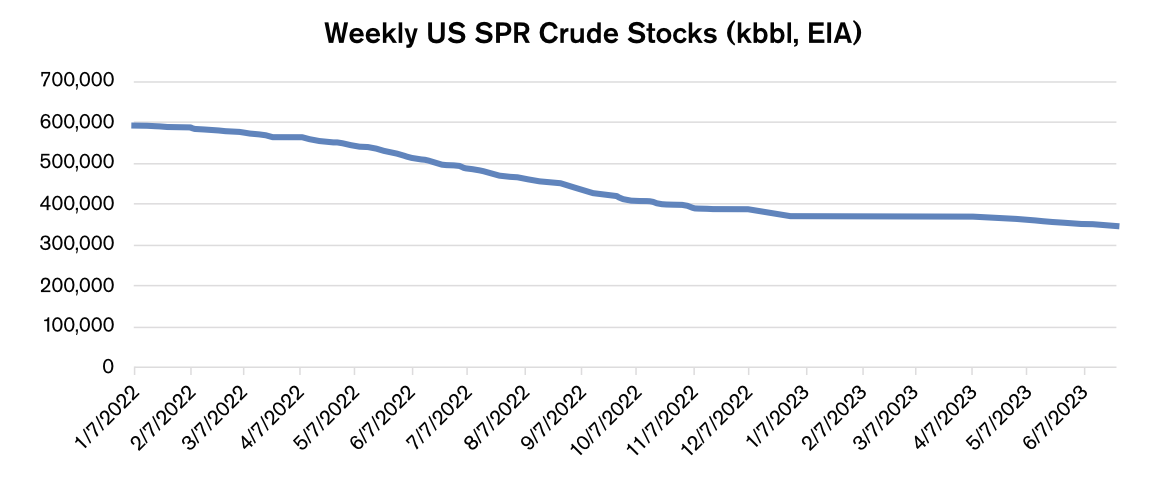
Another factor likely weighing on the market has been the use of the SPR. The White House announced last March that it would be releasing 1mb/d from the reserve for 180 days. Inventory levels in the reserve fell by 148 million barrels (mb) from April through the end of September, and stocks continued to fall throughout the period of the OPEC+ cuts detailed above. SPR stocks fell by an additional 68mb to 349mb by June 23, the lowest level in the weekly data series since 1983.
Non-OPEC+ Supply Growth Expectations
In a July note, Morgan Stanley cut its 2023 and 2024 crude oil price forecasts, citing robust non-OPEC+ supply growth as well as increased production from Iran and Venezuela. Along these lines, the EIA, in its June Short-Term Energy Outlook, said it expects global liquid fuels production to increase by 1.5mb/d this year and by 1.4mb/d next year, primarily due to growth in the United States, Norway, Canada, Brazil, and Guyana. The agency expects U.S. crude oil production will average 12.6mb/d this year, rising to 12.8mb/d next year. This makes sense, at first glance, as the U.S. shale revolution was touted as making U.S. tight oil producers the new swing producers. If OPEC+ should cut production, U.S. shale producers should respond to higher prices and fill that gap. But this has not been borne out by the data this year.
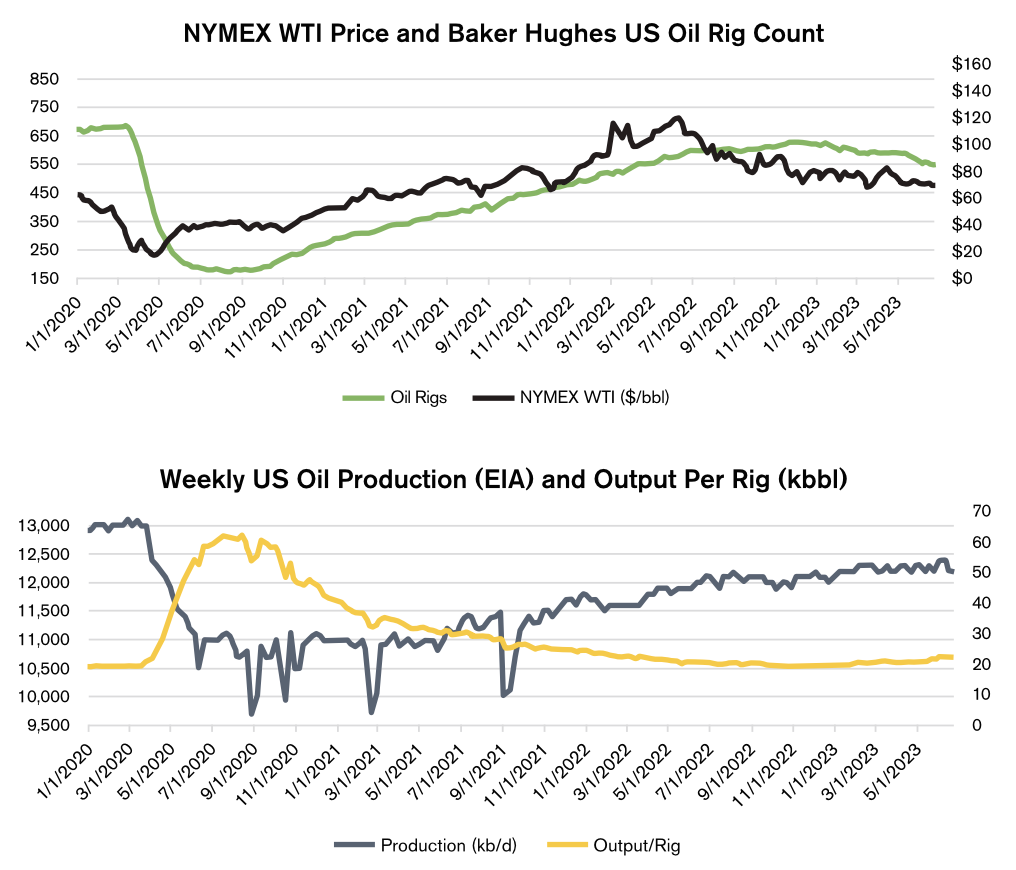
From October of last year through June 23, U.S. oil production increased by just 0.2mb/d, even as WTI prices averaged $83 in Q4, $76 in Q1, and $73in Q2. Only the latest data point as of this writing (12.4mb/d as of the June 30 week) indicated more robust production growth – and this was still far from the 13.10mb/d pre-pandemic high. Meanwhile, the U.S. oil rig count fell along with crude prices – from 602 in early October to just 540 by early July – a 10% drop. Increased efficiency (output per rig) has helped keep production steady or rising slightly, depending on the week, despite the falling rig count. It is likely that a combination of the factors we have discussed above are leading to hesitancy in drilling investment decisions: fears over the global economy and therefore demand, a higher cost of capital due to strong interest rates, high inflation pushing up costs and dampening prospects for profitability, and a “twice-shy” reticence to over-invest after the pandemic price plunge that left shareholders up in arms.
U.S. supply growth prospects, at least as of this writing, did not appear overwhelmingly bright. Also supportive, the U.S. was set to begin refilling the SPR with planned purchases, and OPEC+ had not given any indication that it would deviate from its policy of supporting prices rather than fighting for market share. The big question mark, then, is on the other side of the supply-demand equation: is a more severe economic downturn in the cards, or will central banks manage to achieve a “soft landing” as they fight inflation? Longer term, the International Energy Agency has published forecasts for slowing demand growth over the coming years due to increased renewable energy generation and electric vehicle adoption. While global oil demand is still expected to grow for the next few years, these prospects could lead to lower investment and higher volatility in the oil market.
Dan Lothrop is Head Trader at over-the-counter derivatives company Northland Energy Trading LLC. He can be reached at 800-709-2949 or daniel@hedgesolutions.com.
The information provided in this market update is general market commentary provided solely for educational and informational purposes. The information was obtained from sources believed to be reliable, but we do not guarantee its accuracy. No statement within the update should be construed as a recommendation, solicitation or offer to buy or sell any futures or options on futures or to otherwise provide investment advice. Any use of the information provided in this update is at your own risk.
