
Crude oil production in the United States has been growing at what the Paris-based International Energy Agency (IEA) has called a “relentless pace.” The agency forecasts U.S. crude oil production growth will represent 83 percent of this year’s non-OPEC production growth, at 1.5 mb/d, and that it will continue driving supply growth over the next five years, adding 4 mb/d in production over that time frame. As domestic oil production has boomed with the shale oil revolution, flows — which used to flow in from abroad, and (for the Gulf Coast) then up north toward the Cushing, Oklahoma storage hub — have been reversing.
The 669-mile Seaway pipeline, which historically carried crude oil from South Texas up to Cushing, OK, was reversed and began shipments in the opposite direction in 2012. A twin line began service in 2014, bringing total offtake capacity to 850 kb/d. From January of 2012 to January of 2014, U.S. oil production shot up from 6.16 mb/d to 8.05 mb/d, and reached 9.25 mb/d by December of 2015, when the government repealed a 40-year old ban on exports. Since then, production has skyrocketed to about 12 mb/d, and exports have shot up from about 0.5 mb/d to a high of 3.61 mb/d in the February 15, 2019 reporting week, per data from the U.S. Energy Information Administration (EIA). Both the EIA and IEA expect U.S. exports to continue to grow, with the EIA seeing the U.S. as a net crude oil and products exporter by the fourth quarter of next year (by 0.9 mb/d), and with the IEA seeing the U.S. overtake Russia and close in on Saudi Arabian crude oil exports by 2024. The top five destinations for U.S. crude oil exports last year were Canada, South Korea, China, the Netherlands and the United Kingdom.
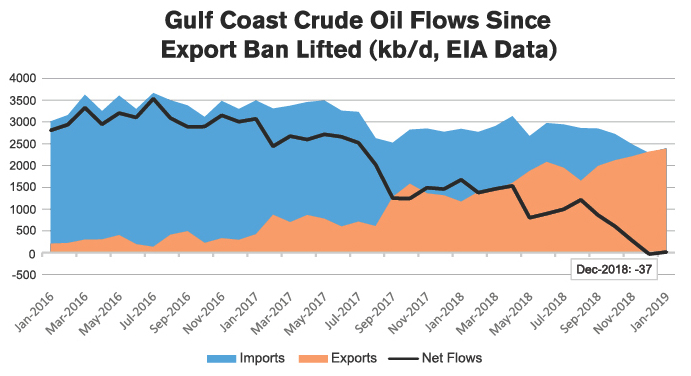
As was the case with propane, much of the focus for crude oil export projects is on the Gulf Coast. As of this writing in early April, there were at least seven projects in various stages of planning and development. Six were located off the Texas Gulf Coast (three of these near Corpus Christi), and one near Venice, Louisiana. Planned export capacity from seven projects by Trafigura, Enterprise, Jupiter, Tallgrass Energy, Carlyle Group/Lone Star Ports, Enbridge Inc, and Magellan Midstream is a combined 10.4 mb/d. Not all projects are likely to be completed, and there will be strong first-mover advantages for these capital-intensive investments. Time frames for completion vary from as quickly as the middle of next year (Trafigura, near Corpus Christi, TX) to late 2021 or early 2022 (Enbridge, near Freeport, TX). Even without these additions, the U.S. Gulf Coast was a net exporter of crude oil in the month of December 2018.
These developments may impact the oil market in a number of ways. Firstly, the Gulf Coast will likely continue taking on increased importance relative to Cushing, OK, particularly following the recent release of competing Permian crude oil futures contracts. CME launched the NYMEX Houston WTI futures contract, and ICE has launched its competing Permian WTI futures. Second, the increasing inter-connectedness — with rising pipeline capacity connecting Permian crude oil production to the U.S. Gulf Coast and new export facilities — is likely to keep the Brent-WTI and, especially, Brent-WTI Houston spreads tighter and more strongly correlated, all else equal. Surrounding the Seaway pipeline reversal, the Brent-WTI spread narrowed from $28/bbl in late in 2011 to $19/bbl, and then to $15/bbl. Recently, this spread has been about half of that, at $7-$8/bbl. The spread will probably never hold near flat, of course, as differences in transportation costs (freight rates, pipeline tariffs, etc.) to bring the two crudes to demand centers will likely remain. The strong liquidity behind the U.S. price benchmarks is relatively attractive compared to the falling volumes underpinning North Sea benchmark prices, and is likely to continue to pressure firms such as Platts and Argus to work to increase the breadth of their North Sea pricing, as they have done several times in the past.
Finally, whereas U.S. crude oil inventories have typically seen a seasonal trend based on refining activity — rising during the fall and spring lulls — growing exports will become an increasingly important factor in their disposition. We have already seen this to be the case in U.S. propane stockpiles, which began last year’s building season at five-year lows but recovered to trend near the prior year’s levels by July 2018 due to a downward trend in weekly exports from May through July. Then, subdued export activity in the fall helped inventories to recover to their five-year average by November 2018. Just as freight rates and the price differential between Mt. Belvieu and Middle Eastern and Asian propane prices drive propane exports, the Brent-WTI (and Brent-WTI Houston) spread is an indicator of crude oil arbitrage economics, and it will be an increasingly important one to keep an eye on as temporarily improved economics are apt to spur additional export activity, and vice-versa.
The information provided in this market update is general market commentary provided solely for educational and informational purposes. The information was obtained from sources believed to be reliable, but we do not guarantee its accuracy. No statement within the update should be construed as a recommendation, solicitation or offer to buy or sell any futures or options on futures or to otherwise provide investment advice. Any use of the information provided in this update is at your own risk.
