All
Major Blowout Imminent?
by Richard Larkin, Hedge Solutions

There’s a storm brewing on the East Coast!
As of this writing around January 11, there is a significant storm brewing on the East Coast. I’m not just talking about the current weather forecast, but instead looking at the distillate inventory data, the 21-day weather outlook, and the ULSD futures relationship on the forward curve. Additionally, there are a couple wild cards that could throw gasoline on the fire.
It used to be that it only took a heavy dose of cold weather to cause prices to spike. Due to the industry’s significant loss of market share over the last decade or so, it now takes a combination of these factors to significantly impact heating oil prices, and they are all showing up on the proverbial radar right now.
This is not a prediction, but like the long-term weather forecasts, bears watching due to the underlying fundamentals that may produce the perfect storm. To help illustrate my point, I’ve included comparisons to the same period in 2015 because it’s the most recent instance that one could characterize as a major blowout in both price and basis. It was February 2015 that we saw rack prices in most of the major East Coast markets experience dynamics similar to those that exist today, causing the basis to blow out, wreaking havoc on your margins and costs.
As a reminder, the term “basis,” as it relates to your rack cost, is the delta between the price from your supplier and the NYMEX spot price. When this “blows out” it usually results in several weeks of chaos that feature prices escalating at a very rapid pace and long lines at the terminals. The speed and intensity of these developments make passing on these costs — including an escalation in labor rates, wear and tear on personnel, and of course, the price itself — very difficult.
These events are not easy to predict or see coming, but there are symptoms that develop ahead of time that hint at a possible issue on the horizon. Let’s take a look at the symptoms and how they compare to the 2015 period.
Backwardation in the Futures Market
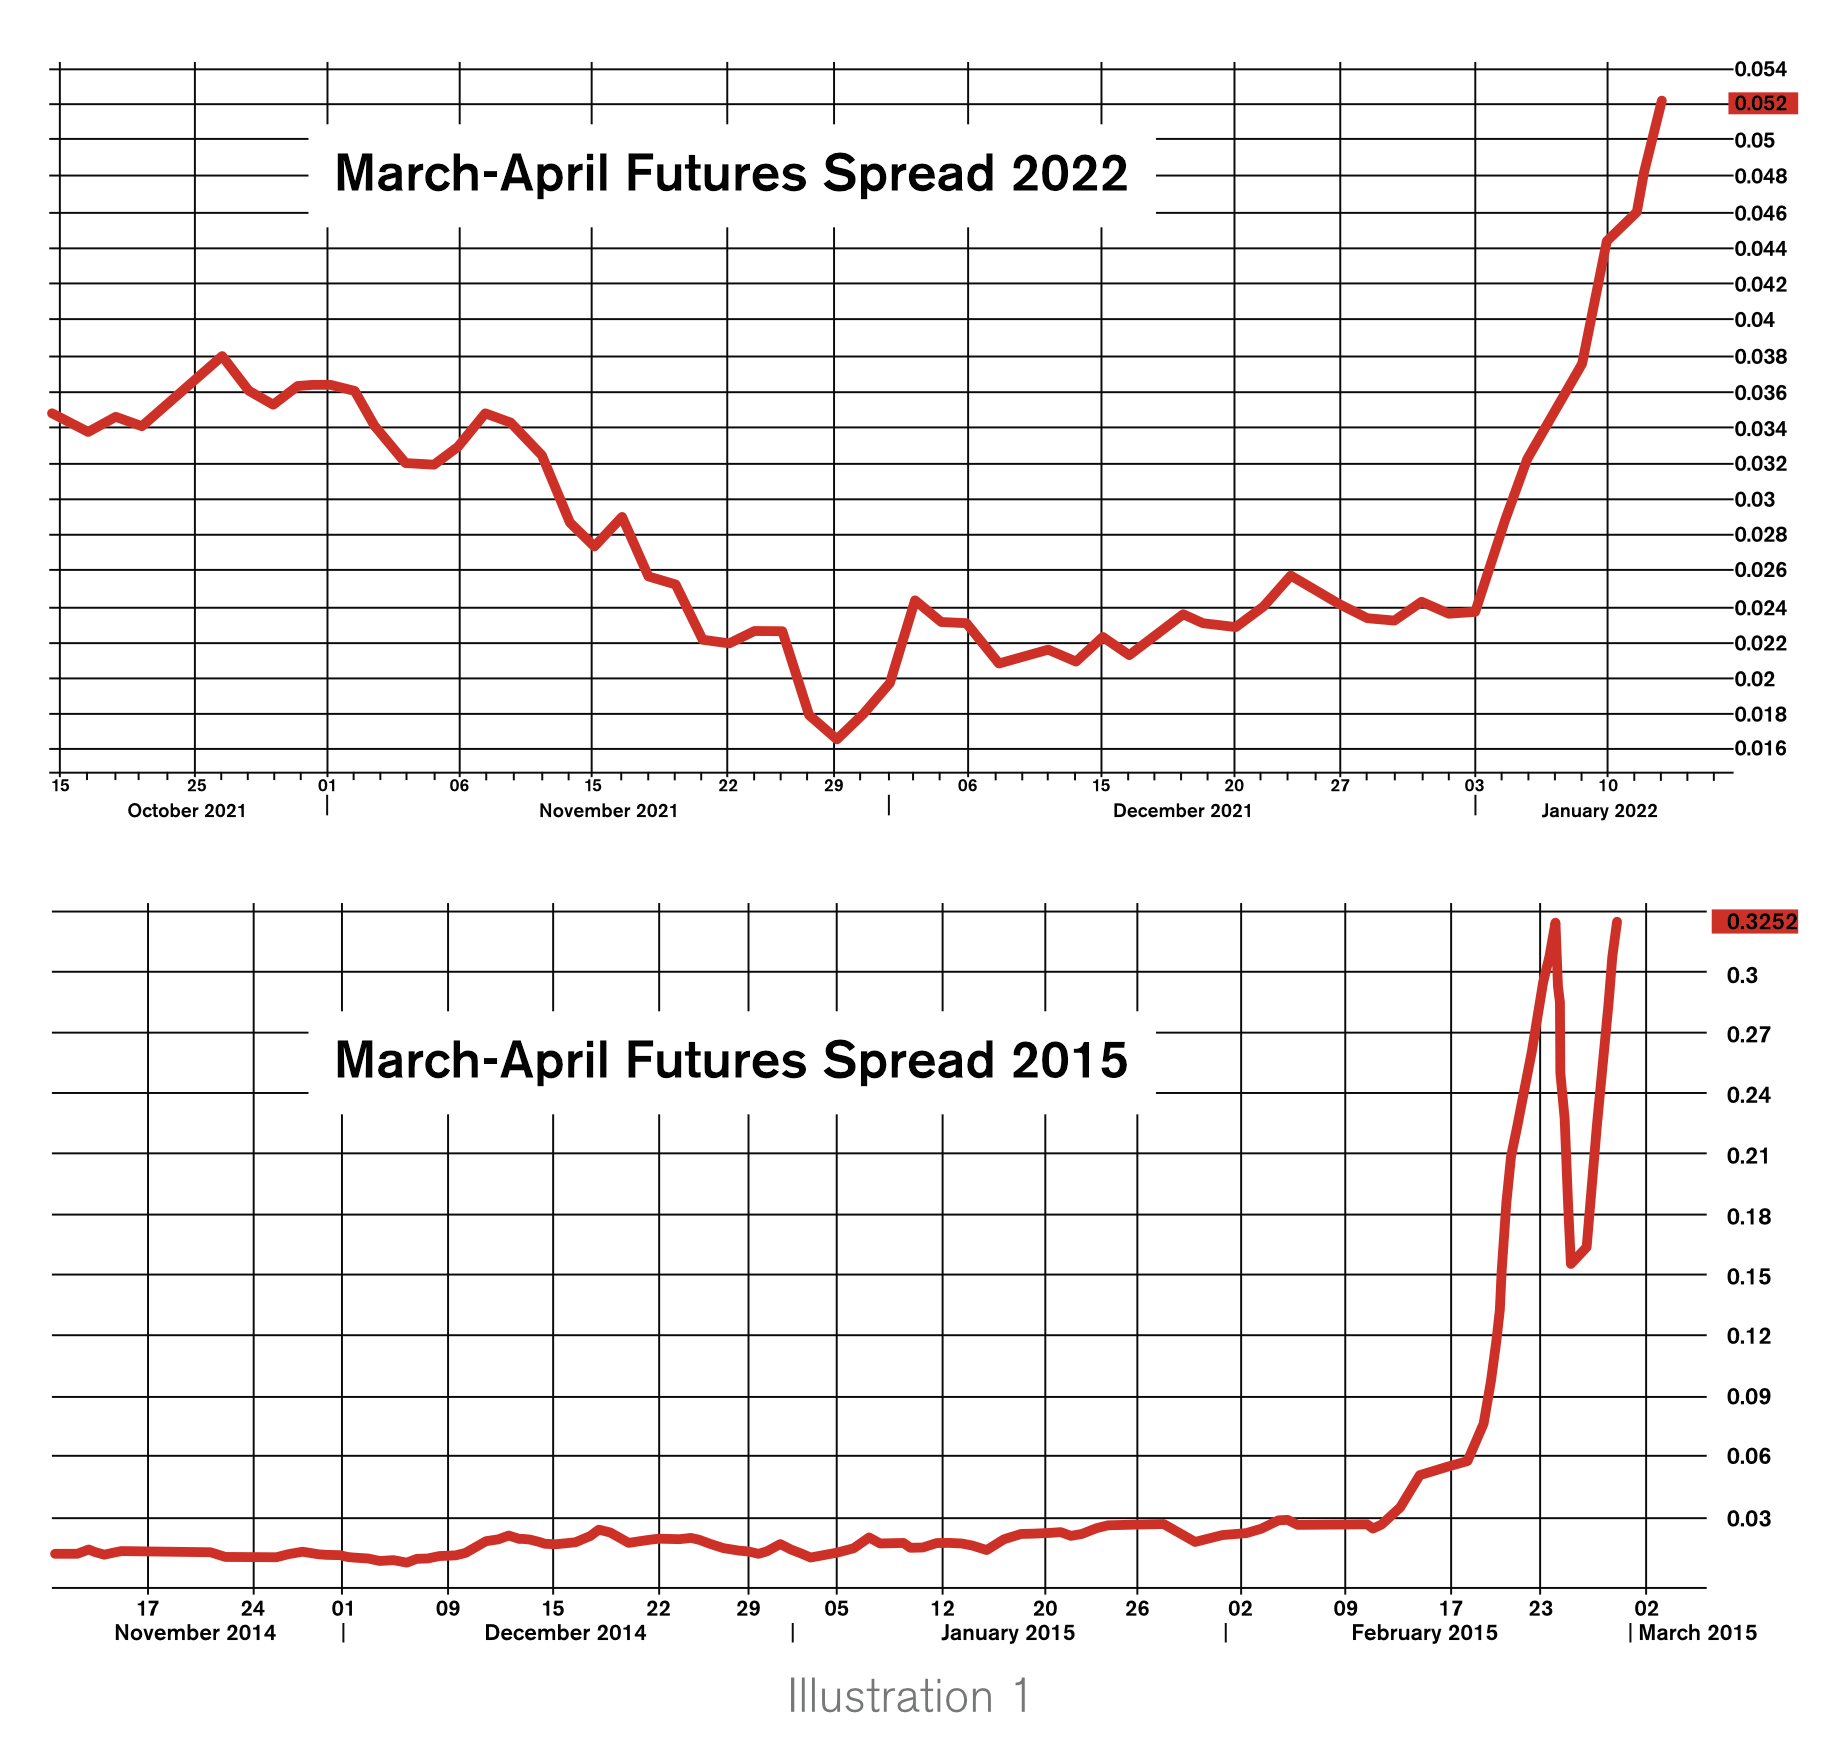
Backwardation is the relationship in the futures market between the forward months. The two charts in Illustration 1 show the March over April pricing relationship. In both the 2015 data and in the current period (March/April 2022), the similarity in the pattern is obvious. Both show a quick and abrupt trend toward backwardation in price. This makes it difficult for wholesalers to bring product into the terminals since they can’t lock in a positive hedge. It elevates their risk.
Why is this a problem? Your suppliers at the local terminals will become reluctant to bring in those barges and cargoes if they know that the hedge is negative or, simply put, the price they pay today is basically cheaper tomorrow.
Bullish PADD 1 (East Coast) Fundamentals
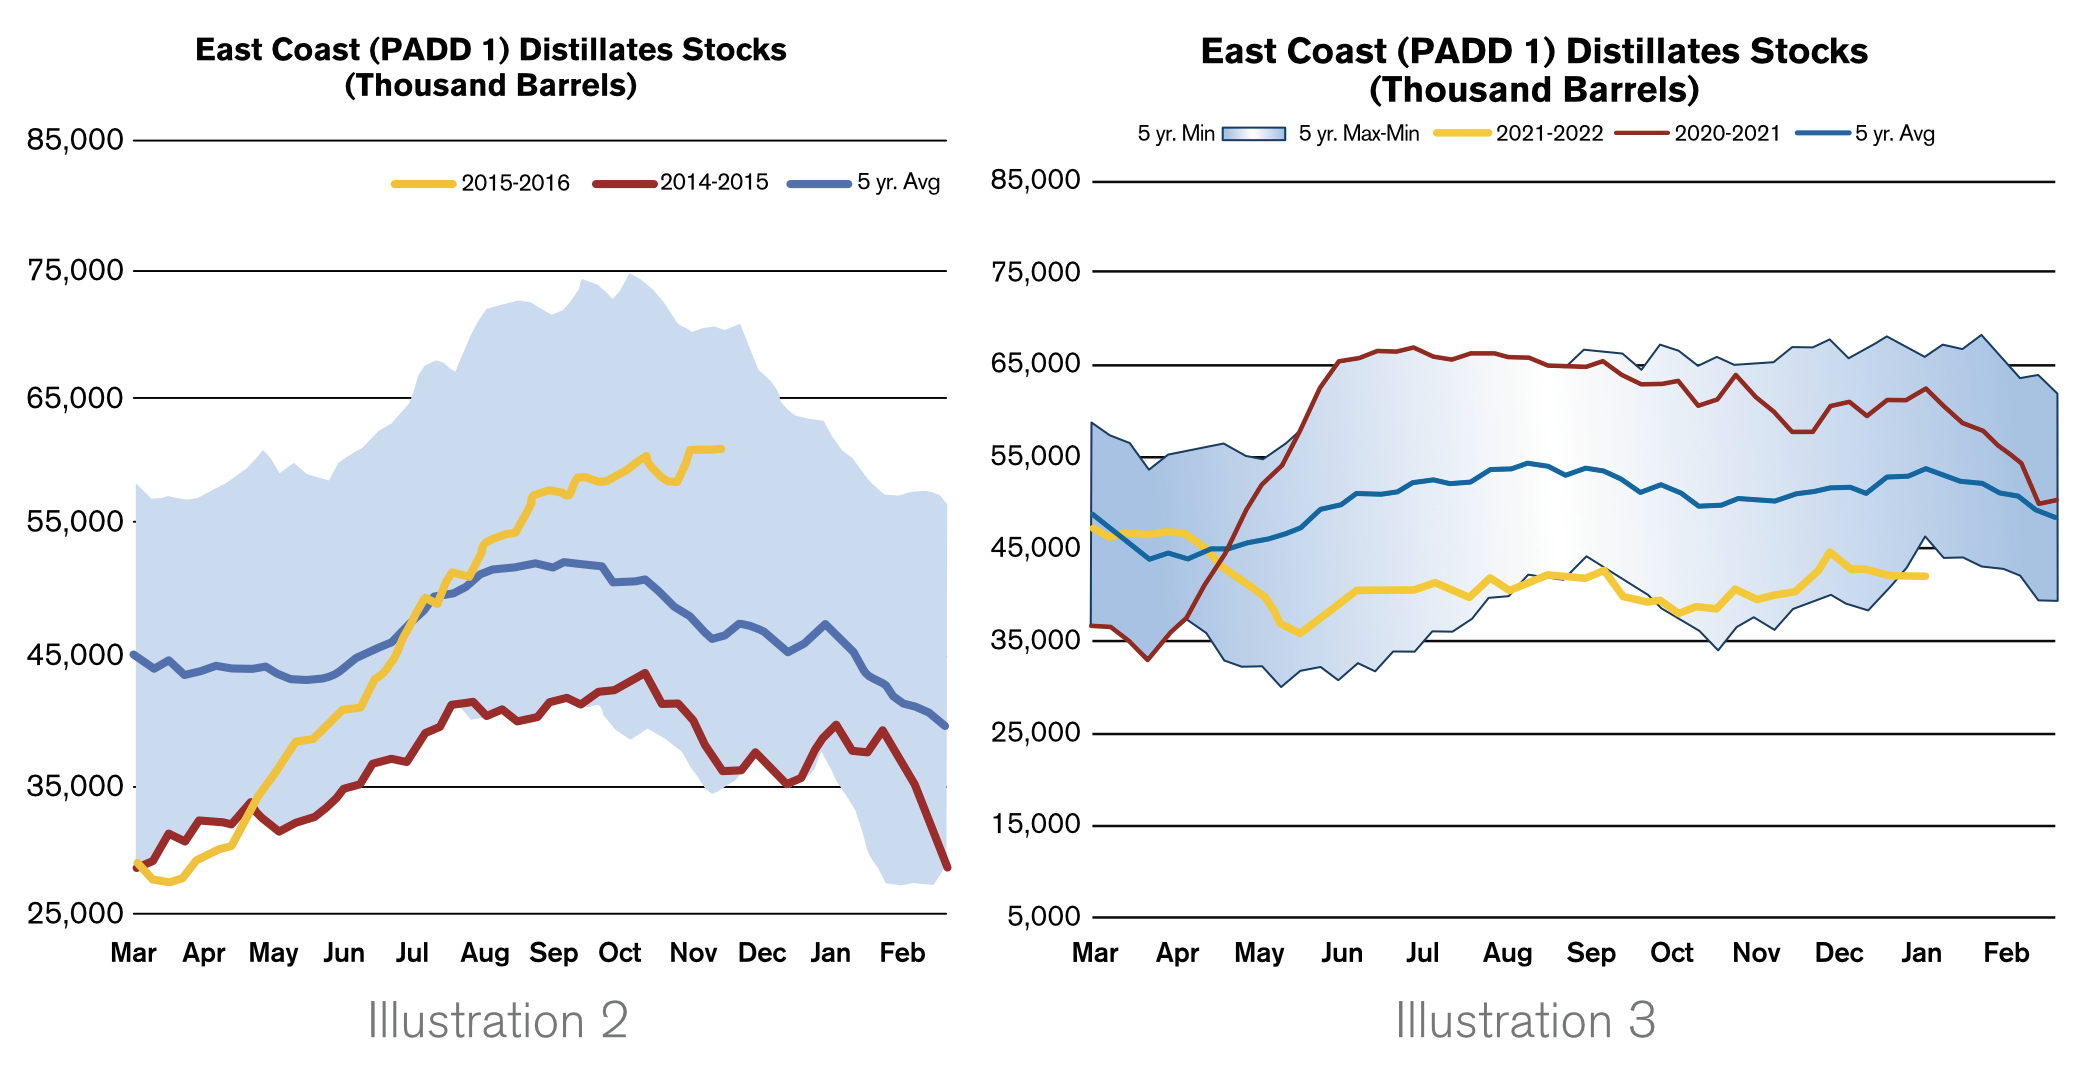
Other factors inviting concern are East Coast fundamentals. Again, using 2015 as a baseline, we can see in Illustration 2 that we entered the same week with East Coast Stocks at around 35 million barrels (mb). As of last week, we were slightly ahead of this number at 42 mb according to the latest Department of
Energy’s inventory report (Illustration 3).

However, a further look at inputs gives cause for concern. In 2015, East Coast production of distillates equaled 1,158,000 barrels per day (b/d). Thanks to several refinery closures since then, the latest PADD 1 inputs are almost half this number at 714,000 b/d. That means we are significantly more reliant on Colonial Pipeline supply and imports when demand ramps up. Additionally, the U.S. total distillate supply is currently well below the five-year average. This means PADD 1 is likely competing with other regions in the country for supply.
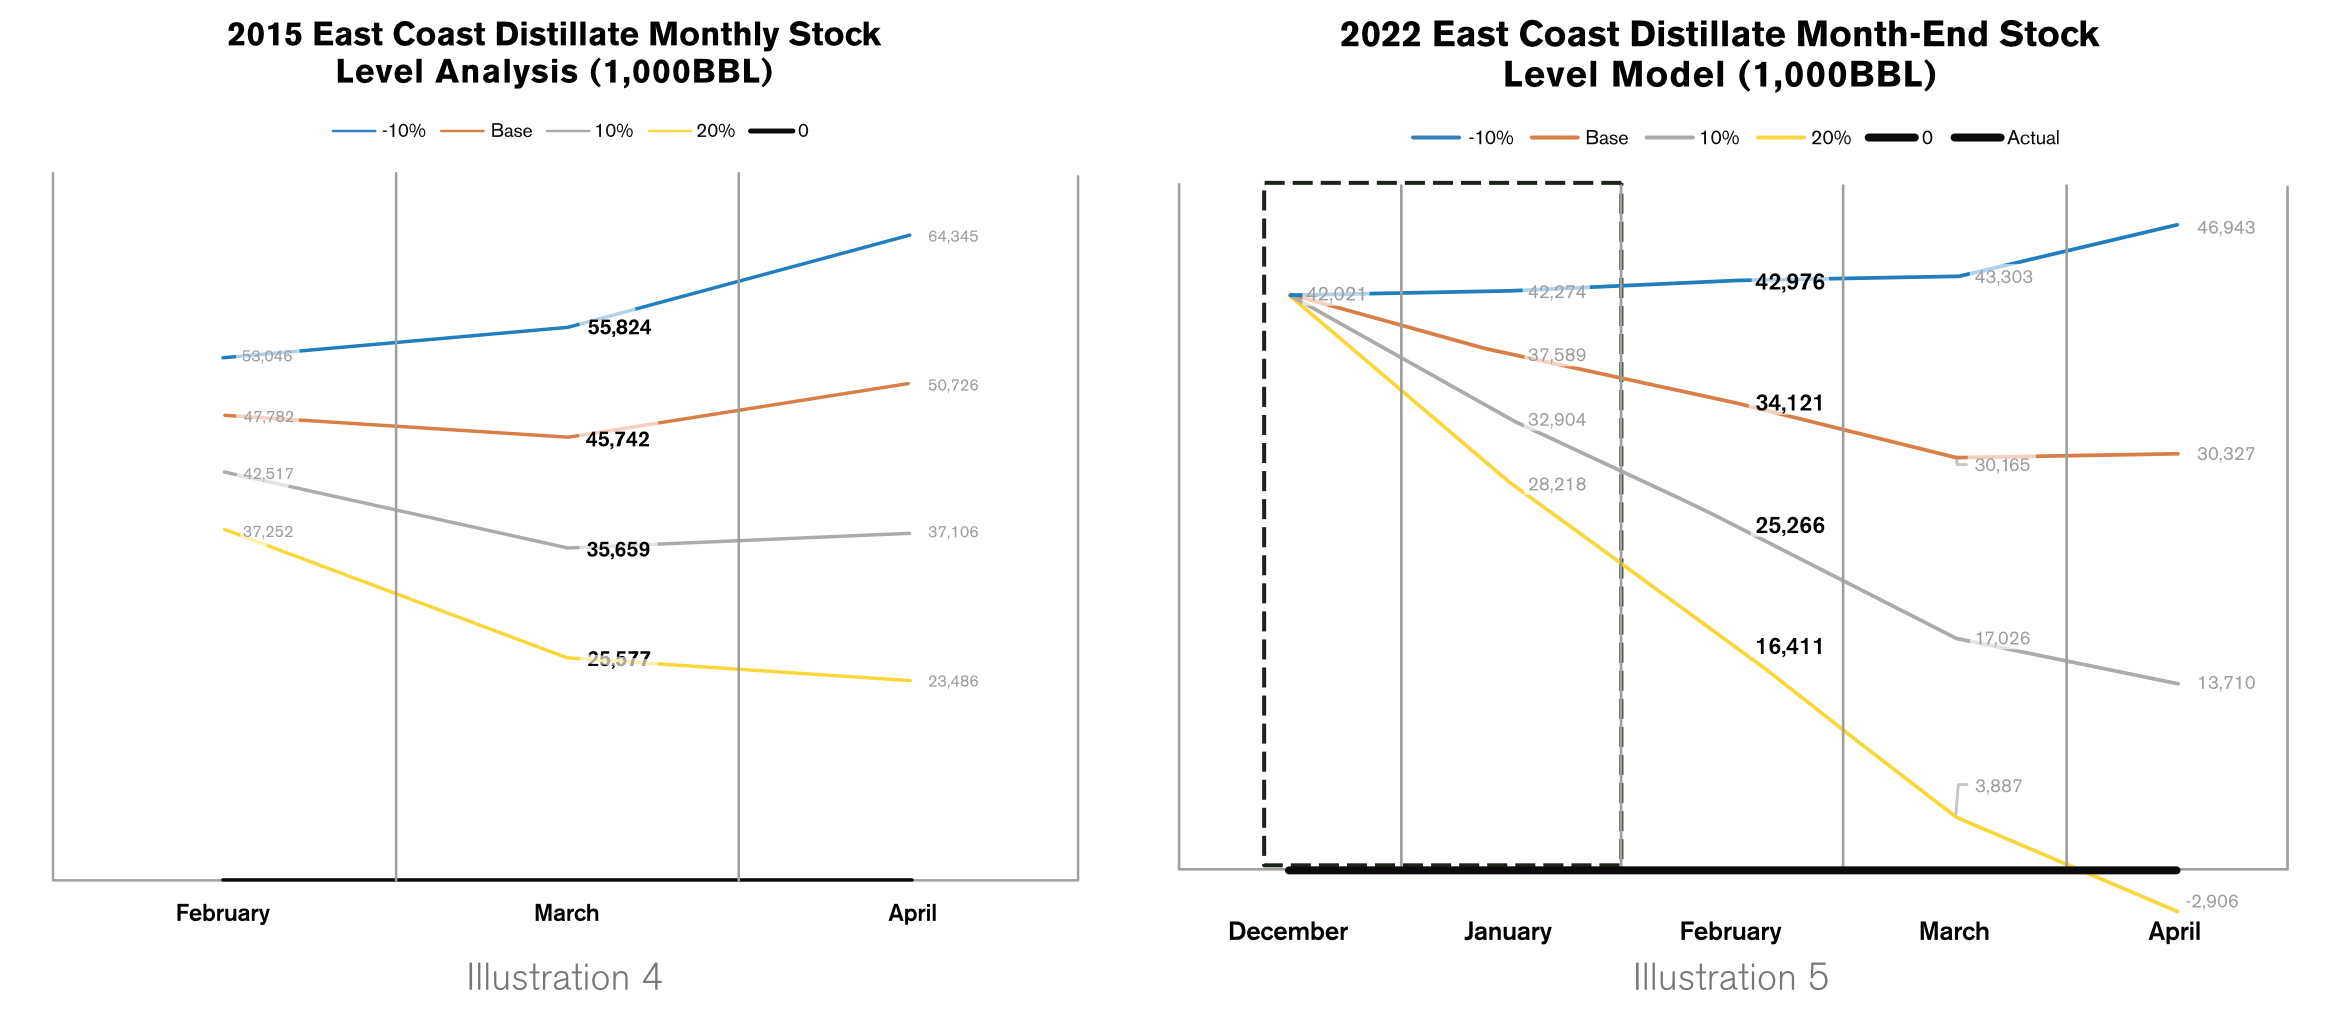
I’ve also provided a unique comparison of the 2015 and 2022 stock analysis. My company does a comprehensive analysis every year that looks at the supply cover for the upcoming heating season. I’ve provided a limited view of that analysis, but it, again, shows a potential scenario for supply tightening if we get a prolonged cold spell.
Keeping it simple, we offer four weather scenarios that predict stock levels based on demand: 10% warmer than normal, normal (baseline), 10% colder than normal, and 20% colder than normal. As you can see in 2015 (Illustration 4), the analysis predicted a stock level of 25 mb based on a 20% colder than normal period. In the 2022 analysis (Illustration 5), we only need a 10% colder than normal period to reach the same 25 mb stock level seen in 2015 – the year of the price blowout.
Other Factors
Namely, the natural gas interruptible: if the gas companies see a large enough draw in their supply cover, we all know what happens. They shut off their interruptible accounts, who then run to the oil companies. This sudden turnaround only adds stress to current supplies.
No one can predict with any certainty what the weather will bring or what the futures markets will do. By the time this article goes to print in February, we’ll be right in the thick of it. Hopefully, supplies will be ample, and prices will moderate. Cold weather is what we all hope for in our business models — we just want it without the expense and stress of blowouts and supply issues.
Rich Larkin is President of risk management consultancy Hedge Solutions. He can be reached at 800-709-2949 or rlarkin@hedgesolutions.com.
The information provided in this market update is general market commentary provided solely for educational and informational purposes. The information was obtained from sources believed to be reliable, but we do not guarantee its accuracy. No statement within the update should be construed as a recommendation, solicitation or offer to buy or sell any futures or options on futures or to otherwise provide investment advice. Any use of the information provided in this update is at your own risk.
Related Posts
 2025 Hedging Survey
Posted on April 29, 2025
 Trump Policies and Energy Markets
Posted on April 28, 2025
 Hedging Strategies for Next Winter
Posted on March 10, 2025
 A Volatile Start to the 2024-2025 Heating Season
Posted on December 9, 2024
Enter your email to receive important news and article updates.


