
Crude oil futures fell into negative territory for the first time in history. Is heating oil next?
On April 20, 2020, NYMEX WTI crude futures traded in negative territory for the first time in history. The sharp contraction in economic activity due to the coronavirus pandemic had hammered products demand, particularly gasoline and jet fuel, pushing refiners initially to switch yields toward diesel and then, as prices fell below variable cost, to cut runs. As refinery appetite for crude oil collapsed and with a strong contango in the market providing economic incentives to do so, players crammed oil into storage – both onshore and offshore. Even railcars and salt caverns were sought in order to store crude. While Energy Information Administration (EIA) data did not put Cushing, Oklahoma inventories at their historical highs as of mid-April, it should be noted that a significant portion of storage is under lease, meaning it may not have been full, but was still not available to new entrants. Holding a NYMEX WTI futures contract into expiration means taking physical delivery of WTI crude oil at Cushing, OK. Heading into expiration, open interest in the front-month May futures contract dried up, as it usually does — in part with the big oil exchange-traded funds exiting — and those caught with an undesired long position found themselves with no place to put the crude oil if they took delivery, and having to pay others to take the contract off of them. Prices fell as low as -$40.32 per barrel (bbl). May futures did recover on expiration day, April 21, going off the board at $10.01/bbl, and new front-month June futures were trading near there at $13/bbl as of this writing in the final days of April. Could the same thing happen to NYMEX HO (ULSD) futures?
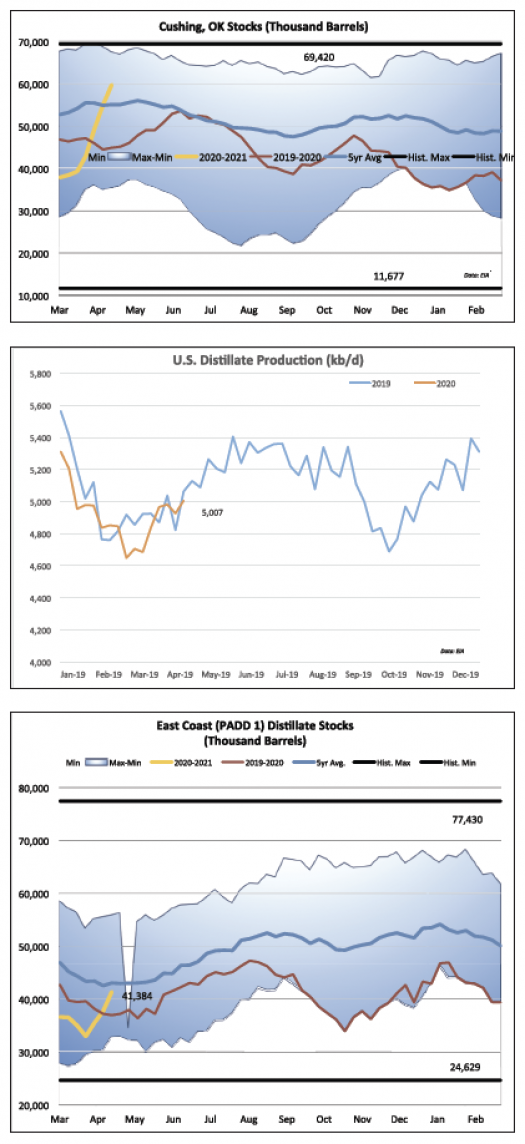
Whereas NYMEX WTI futures specify Cushing, OK delivery, NYMEX HO (ULSD) futures specify delivery at New York Harbor. National distillate stockpiles rose sharply in the first half of April – by 14.16 million barrels (mb) in just the two weeks from April 3 to April 17, when they hit 136.88mb (this was the latest reporting week data available as of this writing). These strong inventory builds came despite a precipitous decline in refining activity, with U.S. refinery runs tumbling down from 15.84mb/d as of the March 20 reporting week to an average of just 12.46mb/d in the week ended April 17 – a drop of 3.38mb/d or 21.3 percent. This, at a time when refiners are usually ramping up runs in order to meet summer driving demand, meant that the year-on-year drop was a sharper 4.13mb/d or 24.9 percent. How then could distillate stocks be rising? In part, this appeared to be due to yield switch as refiners tweaked operations as much as possible to favor diesel output over gasoline and jet fuel (for which demand was hit harder). Accordingly, distillate production at 5.01mb/d in the week ended April 17 had actually increased by 0.17mb/d from the month prior and was just 0.06mb/d lower than during the same week last year.
While distillate output has held up, demand has fallen. Not as sharply as gasoline implied demand, which the EIA estimates plummeted 47.6 percent (4.62mb/d) lower from 9.70mb/d as of the March 13 reporting week to 5.08 mb/d as of the week ended April 10, and certainly not as much as jet fuel demand, which dropped 73.3 percent or 1.27mb/d from 1.74mb/d to 0.46mb/d over the same period, but still significantly. Distillate implied demand was just over 4mb/d in the March 13 reporting week, and fell to 2.76mb/d for the April 10 reporting week, a 31.3 percent drop. So, as with crude oil, we have weak demand, continued production, and there is also a very strong carry in the futures forward curve providing economic incentives for storage operations. On April 27, April 2021 NYMEX ULSD futures (at about $1.08/g) were trading at a premium of nearly 45 cents to front-month May 2020 futures (at about $0.64/g). It should be no surprise, then, that distillate stocks have been building quickly. Weekly EIA data show we are about 49mb away from the historical high of 186mb (April 17 stocks at just under 137mb) nationally, and that East Coast stocks of 41mb are about 36mb away from their historical record – but U.S. stocks rose by an average of over 7mb/d in the April 10 and April 17 reporting weeks, and East Coast stocks jumped an average of 2.8mb/d higher in the three weeks through April 17.
Could we, then, approach tank tops and see a scenario in front-month ULSD futures like we did in May WTI? It is possible, depending on the market balance moving forward. There is concern that export demand to Latin America could be weaker than normal, particularly if the coronavirus outbreak were to affect the region more strongly. But there are also signs that U.S. demand may have reached a low point. One data point does not indicate a trend, but implied demand for gasoline, jet fuel, and distillate fuel oil increased across the board in the week ended April 17. Additionally, the president has released guidelines for re-opening states depending on data trends, and state governors have been working on transition paths.
The information provided in this market update is general market commentary provided solely for educational and informational purposes. The information was obtained from sources believed to be reliable, but we do not guarantee its accuracy. No statement within the update should be construed as a recommendation, solicitation or offer to buy or sell any futures or options on futures or to otherwise provide investment advice. Any use of the information provided in this update is at your own risk.
