
A smaller than forecasted basis is far more common than the dreaded basis blowout
In the commodity space, basis can be defined in a variety of measures. For a refinery, basis is referencing the delta between the futures market and the cash market.
For the purpose of this article, we’ll focus on the local rack basis, or the variance between a paper hedge and the price that your local supplier charges. This calculation is critical when hedging a cap program, for example. You must be able to rely on your assumptions or you could end up with a significant shortfall in your expected profit margin. If the basis widens beyond the historical delta that you used in your forecast, you will likely absorb that loss. This unusual and abrupt widening in the spread between your supplier’s price and your paper hedge is called a “basis blowout” in popular industry terms.
Suppliers like to point out that when you lock in a wet barrel contract, you have eliminated the risk that the basis could blow out. And they are correct in that point. However, basis can also work in the opposite direction in the form of lost opportunity if the basis ends up much smaller than the historical data that you relied on. This actually happens significantly more often than the so called blowouts! But never has this lost opportunity been greater than in the last year. I have highlighted this critical dichotomy for you below and it is worth noting as we come into what I call the “hedging season.”
First let’s look at an example of the so-called basis blowout (illustration A). The normal rack basis for Boston for the past 10 years averages between 5-8 cents per gallon. However, there have been periods of time when the rack basis at Boston terminals has been well above the averages. In February 2015 the rack basis spent the better part of 2 weeks in excess of 25 cents per gallon. If in your hedging equation you had built your profit margin around the assumption that your rack purchases would average 8 cents of basis, you would have come up short 17 cents per gallon. This example is illustrated below.
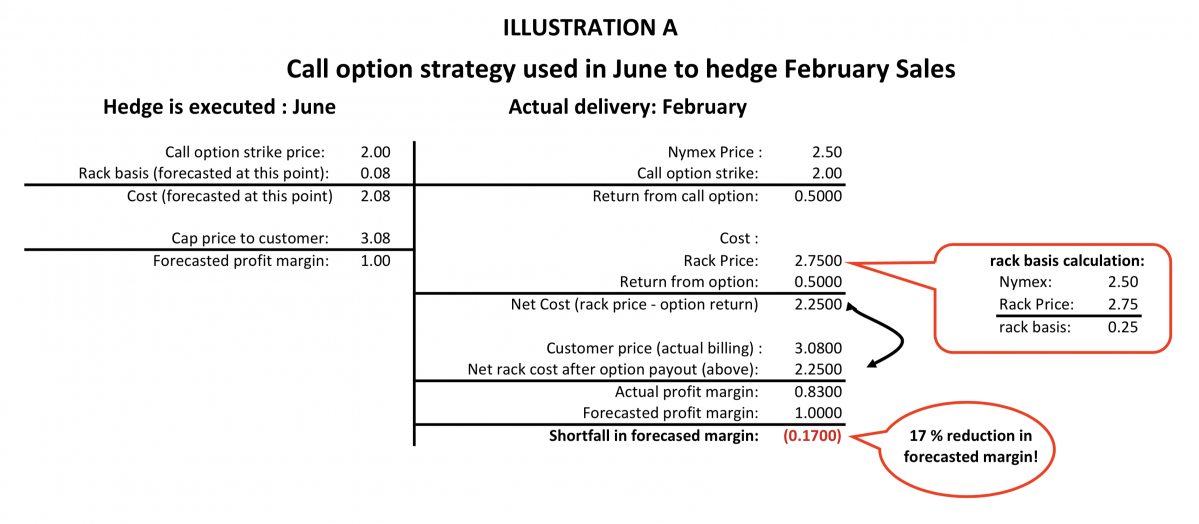
As you can see, the basis between the rack price in February and the Nymex price is .25 per gallon, .17 per gallon more than what was forecasted when the hedge was placed back in June. Because the option return is indexed to the Nymex price at the time of delivery, it is not giving you enough of a return to mitigate the price increase at the rack. The rack price is 2.75 per gallon while the Nymex is 2.50 per gallon. This is what we call a basis blowout — the supplier rack basis is significantly higher than the norm of .08.
Now let’s look at an example that illustrates the exact opposite effect (illustration B). In this illustration, we’re still using the call option to hedge our cap program. Only this time, instead of the rack basis exceeding the historical norm of .08 per gallon, the basis is negative (.10) per gallon. The result is that by having deployed the call option strategy, you are able to take advantage of the negative basis, thereby increasing your margin by .18 per gallon.
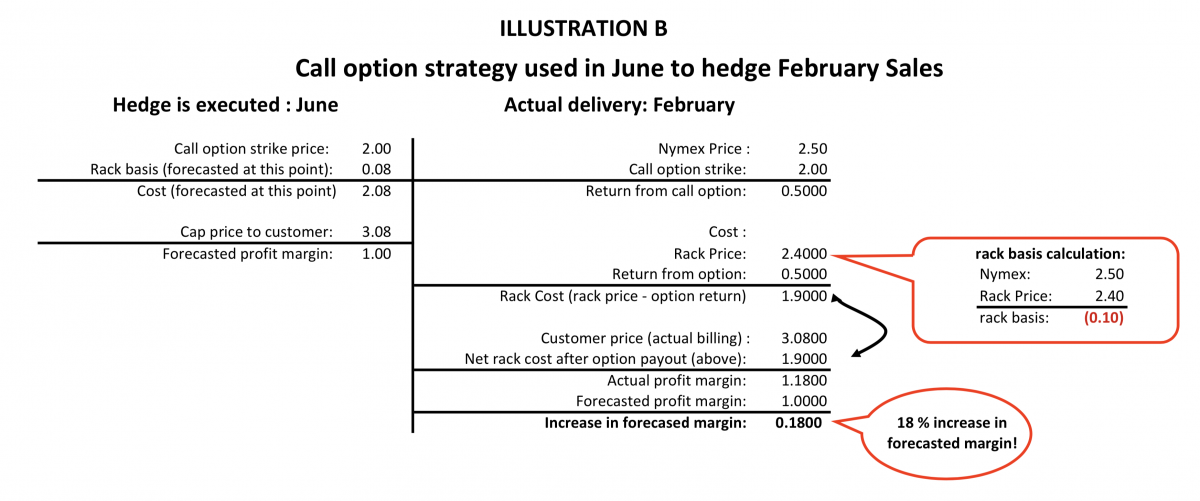
That’s exactly what happened this year. Most of the rack locations in the New England and Mid-Atlantic regions have been pricing well below the spot Nymex price. If you were hedging with call options, your margins on those gallons you used to hedge your cap program should be much higher than forecasted months ago. Using the same process above, if you simply take the difference in the basis that you forecast and the basis at your rack today, you should see an increase in margins by this difference. Therefore, if you forecasted to pay .08 over the Nymex and your current rack basis is (.10) under the Nymex, you will have increased your margin by a whopping .18 per gallon!
What is important to understand in these equations is that this has nothing to do with the Nymex price itself. Whether or not the price is higher or lower than when you hedged, the result is still the same with the basis calculations.
Now let’s review an example of lost opportunity if you used a wet barrel/put option strategy for this winter season vs. just purchasing call options (illustration C). Using the same “math” in each example, you can see where the negative basis results in what I call a “lost opportunity.” The term is intentional. You would still have achieved your forecasted margin of $1.00 by deploying the wet barrel/put option strategy. When comparing this result to the call option strategy, however, the result is a significant lost opportunity of .18 per gallon in profit margin.
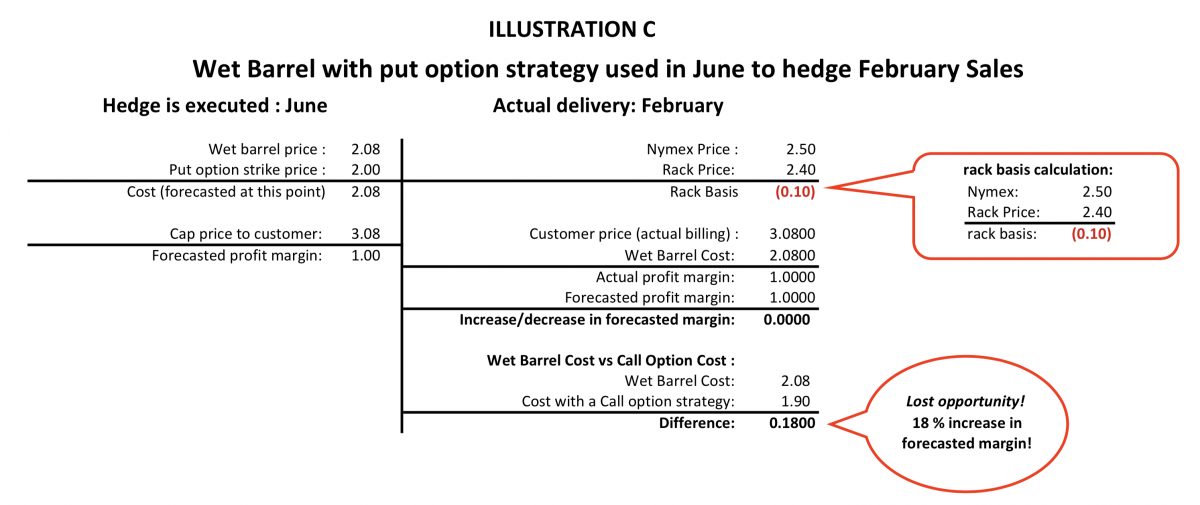
To be fair, you still need to consider the potential scenario in Illustration A vs. C. If the rack basis had blown out, you would have been better off by .17 per gallon with the wet barrel strategy.
So, what is the lesson here? First, you should study your rack basis history. The data will give you significant information that will help devise a hedging program. The short answer is that there is no one-size-fits-all solution. In certain months a call option strategy will benefit you more. You should also make sure that you cover yourself against potential blowouts. However, knowing which months are highest in risk will help you decide where you should deploy the wet barrel/put option hedge. Still, there are significant gains in margin to be made when knowing where to deploy which strategy, as well as which strategies will reduce the option premium cost to you. But that is for another issue.
Rich Larkin is President of risk management consultancy Hedge Solutions. He can be reached at 800-709-2949 or rlarkin@hedgesolutions.com.
The information provided in this market update is general market commentary provided solely for educational and informational purposes. The information was obtained from sources believed to be reliable, but we do not guarantee its accuracy. No statement within the update should be construed as a recommendation, solicitation or offer to buy or sell any futures or options on futures or to otherwise provide investment advice. Any use of the information provided in this update is at your own risk.
