
- Hurricane Harvey slammed into the Gulf Coast as a Category 4 Hurricane, on the night of Friday, August 25. The initial impact was lost offshore oil production and higher crude prices.
As the storm approached, offshore oil platform operators evacuated staff and curtailed operations, cutting production. On Friday, August 25, crude oil prices strengthened, with WTI crude rising 0.9 percent to $47.87/bbl, and Brent crude settling 0.7 percent higher at $52.41. These price gains were likely capped due to the changing U.S. production landscape. Over the years, the so-called “shale revolution” has shifted a large share of U.S. oil production inland and away from the dangers of storms such as these. Whereas Gulf of Mexico production represented 32.21 percent of U.S. production in July of 2009, this share fell to just under 18 percent as of June 2017, despite Gulf production only falling by 5.7 percent over that period, to 1.636mb/d. As of August 28, the U.S. Department of the Interior’s Bureau of Safety and Environmental Enforcement estimated that 19% of Gulf of Mexico oil production, 0.34mb/d, had been shut. This was the peak, and offline output fell to 0.15mb/d by September 1. 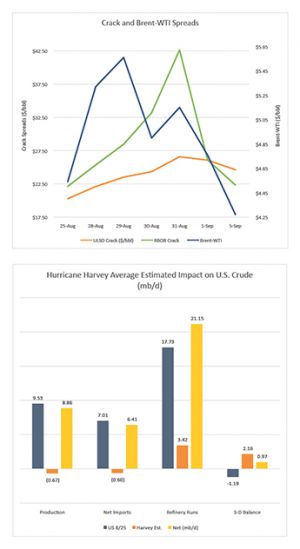 Ship traffic was also affected, as ports along the coastline were closed, cutting maritime net imports.
Not only were offshore oil operations affected by the storm, but so were Gulf Coast ports. The U.S. Coast Guard set port condition Zulu (closed) for sector Houston and Galveston ports on August 25, and for the port of Corpus Christi on August 27. These ports remain net importers of crude oil and net exporters of refined products, so their closure was bullish for crude oil but bearish for products. According to Reuters data, net crude oil imports averaged 0.6mb/d through July, with net gasoline and distillate exports each averaging 0.25mb/d. The Coast Guard began reopening ports on August 31, and most ports were operational by Labor Day although some draft restrictions were still in place, indicating some ports would need to be dredged.- Offline onshore oil production was greater than predicted.
The Eagle Ford shale play, which EIA forecasted would produce 1.38mb/d in August, was not expected to see much impact, as the projected path as of August 25 did not see Harvey moving that far inland. Some 0.3mb/d of Eagle Ford production was taken offline in advance of Hurricane Harvey, but the Texas Railroad Commission later estimated that up to 0.5mb/d of production could be affected amid the flooding. Onshore output typically recovers quite quickly, and company statements indicated this was the case. ConocoPhillips had reached 80 percent of pre-storm output by September 5, and Devon Energy expected to have most assets online by the end of the week. - Attention quickly turned to the larger issue of curtailed refinery operations, and both crack spreads and Brent-WTI widened.
As of the August 25 reporting week, the Gulf Coast was home to 9.75mb/d of operable crude distillation capacity … or 52.6 percent of the country’s 18.56mb/d capacity! Hurricane Harvey was seen as an immediate threat to 1.2mb/d of capacity, with the potential to threaten another 2.5mb/d, for a total of 3.7mb/d or 20 percent of U.S. capacity if the storm turned toward Houston, as it in fact did (Goldman Sachs). The storm shut approximately 2.4mb/d of Texas refining capacity following its initial landfall (Platts). Shut capacity rose to a peak of at least 4.4mb/d by August 30, or roughly the daily consumption of Japan (Reuters).
With demand for crude oil and supply of refined products falling, crack spreads widened. The spread between front-month RBOB futures and WTI futures, in dollars per barrel, shot up from $22.13 on August 25 to $42.65 on August 31. The ULSD crack expanded as well, but to a lesser degree, from $20.27 to $26.59 over the same period. Most of the widening of this spread was due to gains in product futures amid reduced production — RBOB rocketed 35.66c/g higher just on August 30 and 31— but also weakness in WTI amid the decreased demand for crude. WTI fell by $1.30 on August 28, and by another 61 cents over the following two sessions. The Brent-WTI spread widened from $4.54/bbl to $5.56/bbl, making U.S. exports more attractive. - With fewer product volumes being produced, pipelines were forced to slow or shut.
Colonial Pipeline reduced rates on Line 1 and Line 2 and stopped shipments from its Houston-area origin point on August 29 (Platts). Flows on the Houston and Pasadena to Lake Charles, LA section did not resume until September 5, with reduced flows east of Lake Charles in the interim. Colonial’s 1.37mb/d Line 1 carries gasoline, and its 1.16mb/d Line 2 carries distillates up to Greensboro, NC. The mixed 0.9mb/d Line 3 then runs on to Linden, NJ. - The net impact appears to be bearish for crude in the near term, and may make the cash distillate market more susceptible to spikes this winter.
Rough average estimates for the period from August 25 through September 4 point to an average loss of 0.27mb/d in offshore crude production and a loss of 0.4mb/d in onshore crude oil production. Net imports for the affected ports likely fell by approximately 0.6mb/d. This combined loss of roughly 1.27mb/d, however, was far outweighed by an average drop in refining input of 3.42mb/d. Assuming steady levels for the U.S. supply-demand picture from the August 25 weekly EIA data, this implies a shift from a 1.19mb/d crude deficit to a 0.97mb/d surplus.
EIA data for the week of September 1 reported a shallower 0.1mb/d decline in net imports (but also a smaller 3.25mb drop in refinery runs), contributing to a smaller 0.65mb/d daily surplus. While this is bearish for crude oil in the short run, the long-term economic impact from events such as these tends to be positive, leading to a likely overall increase in oil demand.
There are also implications for the distillate market, as Texas Gulf Coast refineries have a relatively high distillate yield of 31.4 percent, versus a 29.3 percent average for the U.S. The loss of stockpiles will depend on how long refineries remained offline, and whether they decide to defer maintenance operations until the spring in order to take advantage of stronger refining margins. East Coast distillate inventories, at 53.67mb, were down by 9.82mb from last year and 4.2mb above their five-year average as of the August 25 reporting week, and further counter-seasonal declines make the chance of a basis blowout stronger on the margin – certainly stronger than last year, and particularly so if we have a colder winter.
Here at Northland Energy Trading and Hedge Solutions, our thoughts are with all those affected by the storm.
The information provided in this market update is general market commentary provided solely for educational and informational purposes. The information was obtained from sources believed to be reliable, but we do not guarantee its accuracy. No statement within the update should be construed as a recommendation, solicitation or offer to buy or sell any futures or options on futures or to otherwise provide investment advice. Any use of the information provided in this update is at your own risk.
