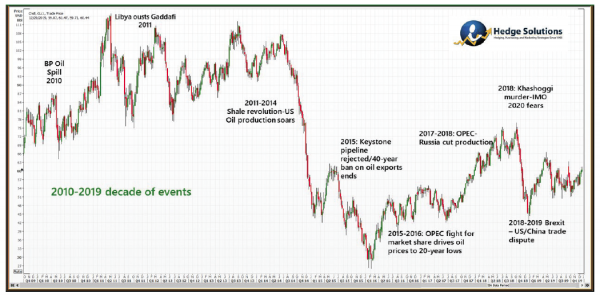
As we look toward a new decade, I thought it might be informative to also look back on the previous 10 years. To help guide this retrospective, I’ve provided some interesting charts on oil market statistics as well as the major events impacting oil markets from 2010-2019.
2010
As the decade got underway, it didn’t take crude oil markets long to make a stark and gloomy appearance on the world stage, evoking ugly memories of the past. The BP Oil Spill in April 2010 captured the world’s attention and provoked a renewed repugnancy for fossil fuels. The size and impact of the spill, caused by a major break in a deep-water rig off the Gulf of Mexico, made even the Exxon Valdez look modest by any measure. Once again, fossil fuels would bake under a dark cloud of ugly headlines for months as oil seeped into the Gulf Coast, causing serious damage to the environment and local economies.
2011
As if oil spills weren’t causing enough grief, the overthrow of the Gaddafi regime in Libya, which led to uprisings in Tunisia and Egypt, gave world oil markets the jitters as many wondered who’s next to rise and fall in the Middle East. Oil prices spiked to over $100 per barrel for the second time in three years.
In an unprecedented move, the Obama administration released 30 million barrels from the Strategic Petroleum Reserve over a 30-day period while at the same time other members of the International Energy Agency released 30 million barrels, citing a significant threat to a fragile global economy.
2011-2014
What do high oil prices beget? Apparently, a lot of innovation as well as blood, sweat and tears. As OPEC held their ground on increasing output, enjoying yet another windfall of profits, there was a quiet revolution looming in the backwaters of North Dakota called Bakken. Additionally, places with names like Permian, Eagle Ford and Haynesville became home to the latest oil boom.
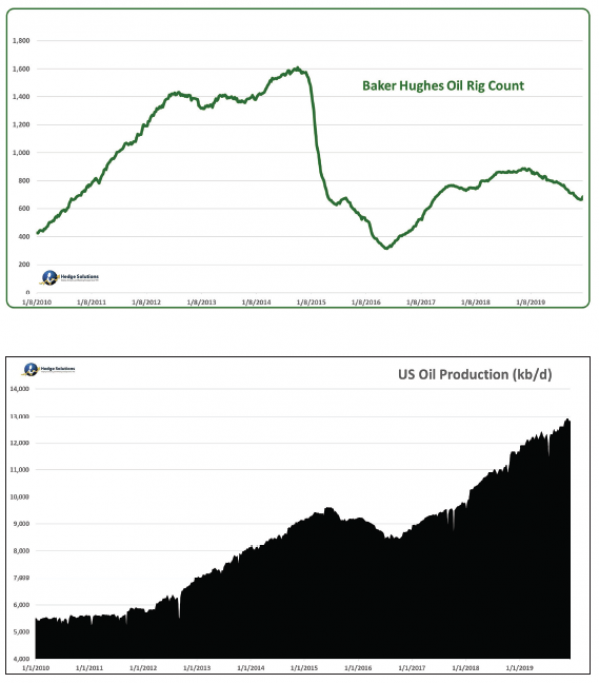
The discovery of shale oil and the technique used to get it out of the ground economically, called fracking, transformed U.S. dependency on foreign oil and would dramatically shift the playing field in global oil economics. The U.S. rig count increased a staggering 400% from 2010-2014 (see first graph below). U.S. production, after hitting a low in 2008 of 3.8 million b/d, would rise to a staggering 12.9 million b/d reached just recently (see second graph below). The shale revolution would make its mark in history!
2015
Two major events would have a major impact on the industry in 2015. In November the Obama administration rejected the proposed Keystone Pipeline, blocking the flow of 800,000 barrels a day of Canadian crude oil to Texas refineries. A month later Congress lifted a four-decade-old ban on U.S crude oil exports. Shale oil, a light crude oil not well suited for most U.S. refineries, would soon find markets abroad, and the U.S. would eventually find itself a net exporter of crude.
2015-2016
With U.S. production rising to record heights, imports dropped to the lowest level in 20 years. As OPEC made the imprudent decision to fight for market share, oil prices plummeted to a low of $26/barrel in January 2016. Heating oil prices fell below $1 per gallon on the NYMEX for the first time in over 10 years. In the middle of winter! Happy days were here again as consumers enjoyed their own windfall.
2017-2018
OPEC would eventually shift its strategy from knocking heads on price to a production pact that would include Russia. Prices rebounded in 2017.
Then, on October 2, 2018 Jamal Khashoggi, a Saudi dissident and critic who was also a columnist for the Washington Post, was murdered in what is believed to be a Saudi sanctioned assassination that took place at their own consulate in Istanbul, Turkey. Demonstrations, amid global outcry, sent oil prices soaring as the markets feared a reprisal that would never materialize.
Meanwhile, ULSD prices also soared as IMO 2020 fears made an early debut. Shortly thereafter, prices would yet again plummet, as markets feared the demand side of the equation emanating from the Brexit turmoil and Trump’s hard-line stance on trade policy with China.
Present Day
As we approach the end of the decade (December 2019 as of this writing), WTI crude oil is trading at around $60 a barrel on the Nymex, about $18/barrel below the January 2010 price. ULSD, the proxy for heating oil prices, looks like it will leave this decade at around $2.00/gallon, 11 cents below the January 2010 ULSD price ($2.11/gallon).
I certainly will not attempt to predict where oil prices will be 10 years from now, nor which events will influence their movements. However, I would dare say that this industry will have a very different look and feel to it 10 years from now, as will the entire fossil fuel panorama.
As always, please feel free to email me at rlarkin@hedgesolutions or call 603-644-3343 with comments or questions.
The information provided in this market update is general market commentary provided solely for educational and informational purposes. The information was obtained from sources believed to be reliable, but we do not guarantee its accuracy. No statement within the update should be construed as a recommendation, solicitation or offer to buy or sell any futures or options on futures or to otherwise provide investment advice. Any use of the information provided in this update is at your own risk.
