
As markets normalize, inventories stabilize
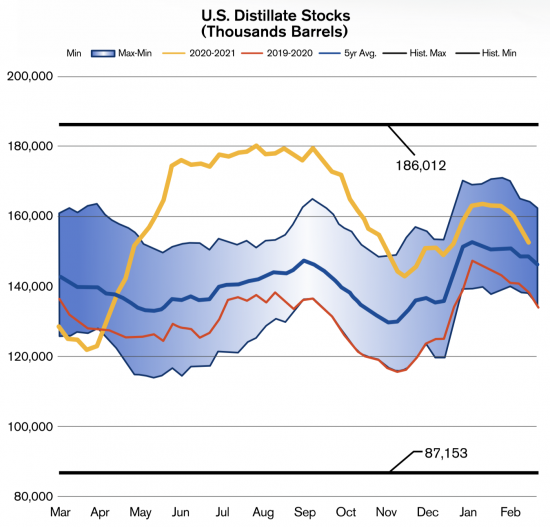
U.S. distillate stockpiles ended the 2019-2020 heating season well below their five-year average and even weaker than following the 2018-2019 season, which set the bottom of the five-year range in the first reporting week of April. Then, the pandemic struck. Jet fuel and gasoline demand collapsed, and with economics favoring diesel, refiners retooled to increase distillate yields. The heat crack — the spread between spot NYMEX HO (ULSD) and ICE Brent crude oil futures — shot up last spring, while the gasoline crack (NYMEX RBOB vs. Brent) weakened sharply. Additionally, the collapse in demand left futures forward curves in a carry, providing economic incentives for storage. U.S. distillate inventory levels rocketed higher from an April 3 low of 122.72 million barrels (mb) to 174.26mb by May 29. In just nine weeks, stockpiles jumped 51.54mb, or 42 percent higher, and went on to average 177.04mb through the middle of September – well above the five-year range.
The market operated as it should, however, and stock levels normalized during the course of the fall and winter. Inventory levels dropped from 175.94mb on September 18 to a seasonal low of 142.63mb by November 20 – a 33.31mb or 19 percent decline in 10 weeks, which brought stock levels back within their weekly five-year range.
Why did this sharp drop occur? As we can see, the decline followed the seasonal pattern, as cooling temperatures and midwestern agricultural use on the demand side and the refinery maintenance season on the supply side tend to put downward pressure on inventories. The decline was sharper than the historical pattern, of course, leading to a rapid reduction in the inventory overhang, and we can point to a few reasons: the gasoline crack recovered against the heat crack in the summer, production reflected this change and fell to year-on-year deficits beginning in the summer, and distillate demand was relatively robust through the pandemic compared to other liquid fuels. The decline could have been even sharper, but exports waned year-on-year as foreign demand centers were hit by the pandemic.
The Count
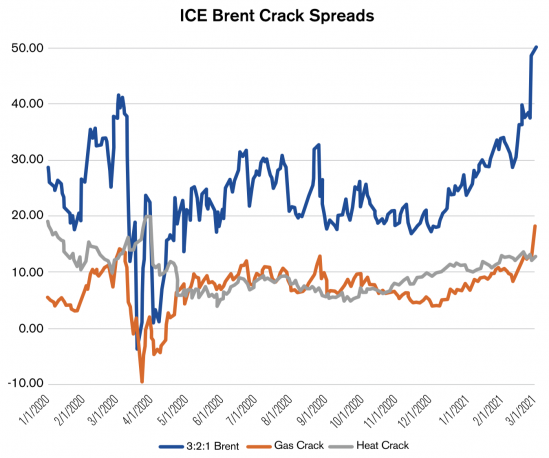
Let’s put some numbers to the above factors. The heat cracked averaged $14.22 last January while the gasoline crack averaged $9.97, a $4.25 spread. The spread blew out in early March as the pandemic hit, with the heat crack averaging $13.33 from March 2-10 and the gasoline crack dropping to an average of just $0.30 during the same period – hitting negative values in four of the seven sessions. Things normalized by early May, however, with the gasoline and heat cracks near each other through the fall, when the heat crack once again took over. As of this writing, the gasoline crack had jumped to take the lead with spring approaching and better economic conditions expected as coronavirus vaccine distribution was underway, particularly in developed countries with larger per capita oil consumption.
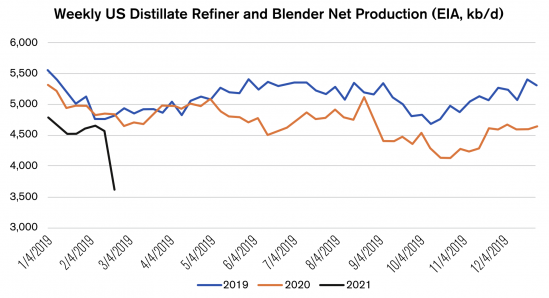
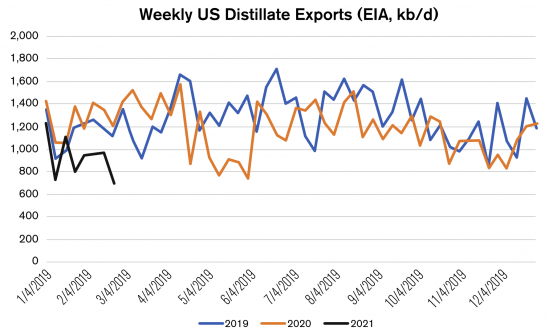
The above pattern in crack spreads was reflected in production figures. Output in early 2020 was relatively similar to that from 2019 through early May, but then averaged 4.61mb/d for the remainder of the year – compared to 5.16mb/d for the same period in 2019. This can be seen in the included chart, which also shows the strong impact of the frigid temperatures that hit Texas in February, strongly affecting refinery operations in the week ended February 19.
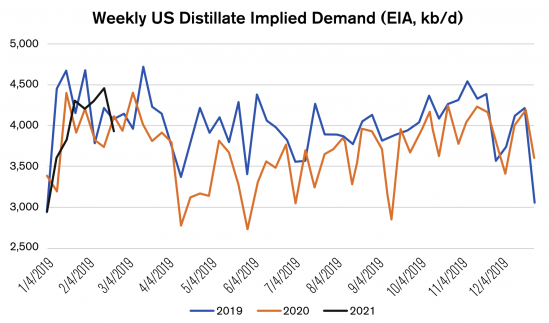
Along with the above drop in production (year-on-year), relatively robust demand helped to put downward pressure on inventories this heating season. From April 12 through June 21, weekly distillate implied demand (as measured by product supplied) averaged 0.66mb/d lower than the previous year, but averaged just 0.19mb/d lower year-on-year from September 6 through the end of the 2020. In the week ended February 12, 2021, implied demand actually jumped to 4.45mb/d – well above the 3.73mb/d from 2020 and the 4.22mb/d seen in 2019 amid cold temperatures.
Finally, a drop in year-on-year exports, as foreign demand has been subdued, prevented U.S. distillate stock levels from normalizing even faster. Exports averaged 0.17mb/d higher year-on-year in the first quarter of 2020, but tumbled as the pandemic hit and restrictions were put in place, averaging 0.32mb/d lower year-on-year in the second quarter. Exports ran even weaker in the first two months of 2021, down by an average of 0.33mb/d.
The end result of the above factors was that a huge surplus in national and East Coast (PADD 1) distillate stockpiles was sharply reduced, as the market functioned to balance itself. As of the February 19 reporting week, U.S. distillate stock levels were just 2.8 percent stronger than their weekly five-year average, and East Coast inventories were at a 2.4 percent deficit to their five-year average.
Things to Watch
Where will things go from here? Well, the seasonal trend calls for U.S. inventories to fall through sometime in May, and a backwardated NYMEX HO (ULSD) futures forward curve as of this writing was certainly not providing any incentives for storage operations. Stockpiles then typically rise through late August or early September. How much they might rise will likely depend upon the path of the normalization of activity as the vaccine rollout continues, as gasoline production will be the driving factor behind refinery utilization rates according to Wood Mackenzie (Oil markets 2021: What to Watch).
Of interest this year is the implementation of the EPA Fuels Streamlining rule, which maintains the stringency of existing fuel specifications but simplifies regulations, according to OPIS (Oil Market Outlook 2021). With gasoline not facing daunting volatile organic compound (VOC) testing, and instead being tested for benzene, sulfur, and Reid Vapor Pressure, OPIS believes support for a wide gasoline crack may be lessened.
Also of note is that OECD-country refining industries have been under pressure, which could push consolidation, involving shutdowns and/or repurposing. Along with domestic supply, the paths inventories will take will differ depending on export arbitrage opportunities and the appetite in foreign demand centers. Much is uncertain, but the path inventories took from the spring through the fall of last year indicates that, eventually, market forces do work to right the ship.
The information provided in this market update is general market commentary provided solely for educational and informational purposes. The information was obtained from sources believed to be reliable, but we do not guarantee its accuracy. No statement within the update should be construed as a recommendation, solicitation or offer to buy or sell any futures or options on futures or to otherwise provide investment advice. Any use of the information provided in this update is at your own risk.
Dan Lothrop is Head Trader at over-the-counter derivatives company Northland Energy Trading, LLC. He can be reached at 800-709-2949 or daniel@hedgesolutions.com.
