
Past as prologue – what historical trends tell us about the coming winter
Are basis blowout risks elevated or muted this winter? A simple answer would be to look at storage levels and compare them to historical levels, as inventories serve as a cushion against demand spikes or supply shocks. However, we may be able to glean more from a more detailed analysis that uses recent historical data to model the path of inventories under different scenarios. This is an exercise we undertake ahead of the heating season each year here at Hedge Solutions – modeling East Coast (PADD 1) distillate inventories.
The U.S. Energy Information Administration is a wonderful source of data. They provide both weekly estimates, but also (we expect) more accurate monthly data on inventory levels, inter-regional movements, imports, exports, and production. Using these figures, we can calculate a proxy for demand: implied demand, as measured by product supplied. We will take each of these factors in turn, construct a five-year average for the October through April heating season, and see what current trends suggest about each factor relative to that average.
The most important source of distillate supply to the East Coast is not through regional production but via the 2.5 million barrel per day (mb/d) Colonial Pipeline system, which brings refined products all the way up from Houston, Texas to Linden, New Jersey. On average, 0.87mb/d of distillates move from the Gulf Coast to the East Coast from October through April by pipeline, barge, or rail – largely by pipeline on Colonial. Shipments have tended to be a bit higher in November (0.92mb/d) and February (0.93mb/d) than in other months over the past five winters. We also see a small amount of product flow in from the Midwest (PADD 2) to the East Coast, bringing the total average influx by pipeline, barge, and rail to the region to 0.91mb/d. We do ship some distillates out to other regions as well, at an average 0.09mb/d during the winter. These averages – and many other figures that we will be looking at – are slightly depressed due to the 2020 shutdowns related to COVID-19. There do not appear to be any unusual factors that should affect the pace of these shipments this winter.
The next largest source of product for PADD 1 is also not production, but net imports. While the U.S. is very much a net exporter of distillates, the East Coast is a net importer, bringing in an average of 0.21mb/d and shipping out a much smaller average of 0.02mb/d during the winter. Imports generally follow a curve that rises through December and then falls back down, whereas what little exports there are tend to be highest in February and March. There do not appear to be any unusual factors that should affect the pace of net imports this winter.
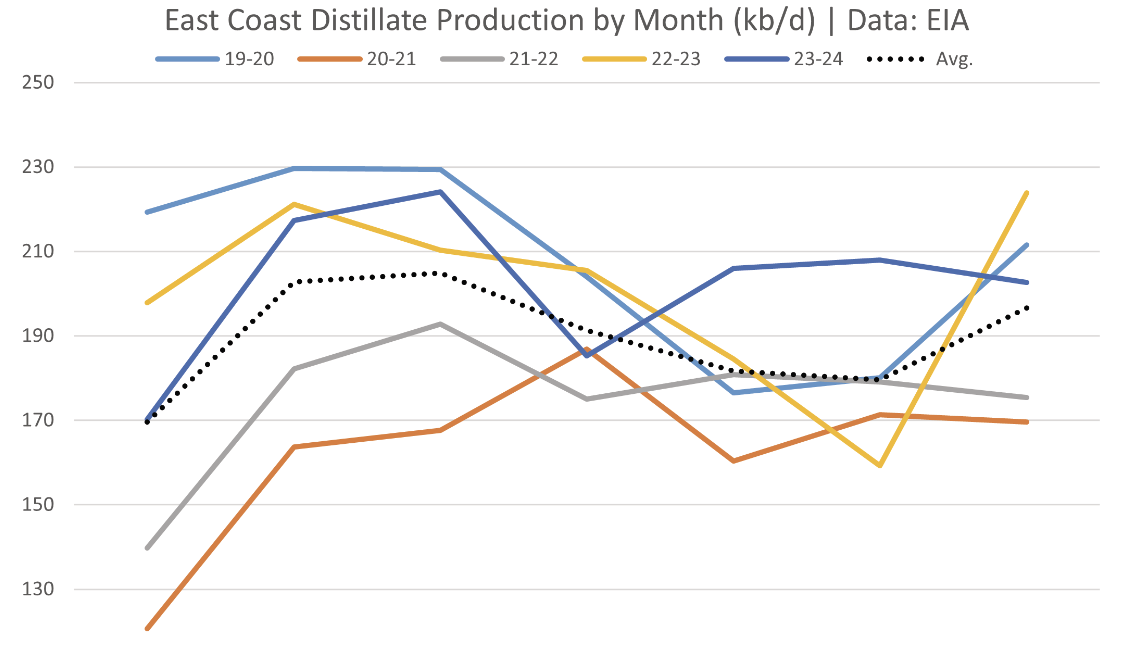
The final variable on the supply side of the equation is regional refinery production, which follows a very seasonal trend. The fall usually brings about a period of refinery maintenance and turnaround operations, as refiners switch from producing summer grade gasoline to winter grade, and as they tweak yields away from gasoline and toward distillates after the summer driving season has ended. This can also be a good opportunity to repair or improve parts of the refinery. Accordingly, distillate production tends to rise from October through December, but then falls once again as refineries start to gear up for the next summer driving season. On average, the region produces 0.19mb/d of distillates. Crack spreads, a proxy for refining economics, have been narrowing over the last couple of years. The diesel crack spread – the difference between the NYMEX HO (ULSD) futures price and the NYMEX WTI futures prices (both in dollars per barrel) has fallen from as high as $75.26 in late August of 2022 to a high of $59.09 in August of 2023, and down to a high of $24.76 this August. This is back near levels we saw in 2021 (a $19.29/bbl August average) but means that refiners are more likely (all else being equal) to shut down for maintenance and retooling rather than defer this work in order to take advantage of relatively strong economics.
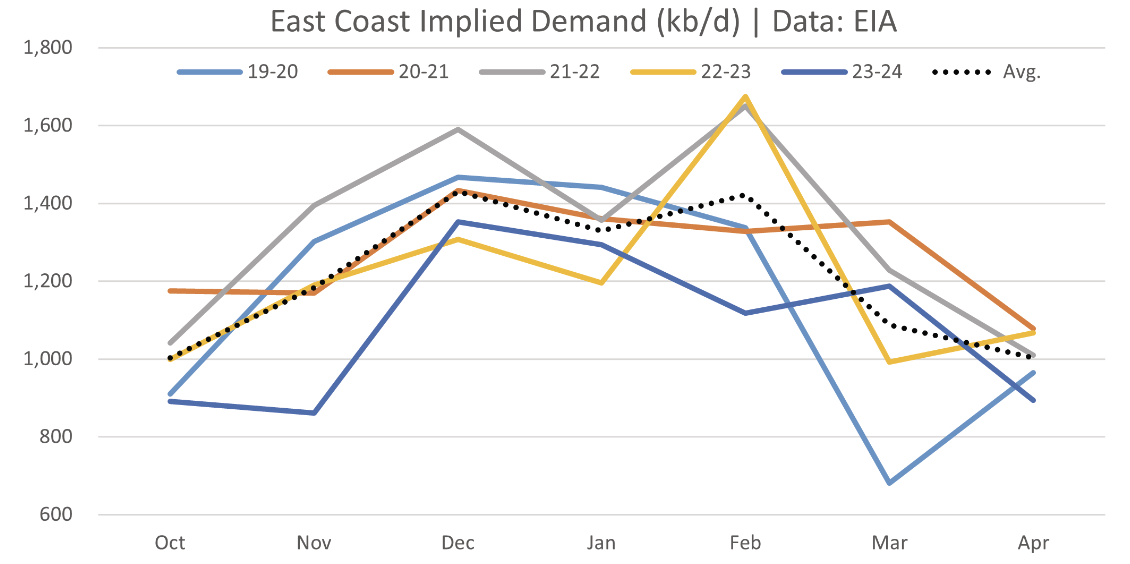
We have now outlined all of the sources of supply, as well as exports and shipments out to other PADD regions. By looking at the monthly change in inventories, we can then calculate how much demand there must have been in order to balance these out. As with production, we have here a very clear seasonal trend and one that we would expect: there is a curve that reflects the impact of heating degree days. In its August Short-Term Energy Outlook, the Energy Information Administration calculated that, based on NOAA projections, we should see 5.7 percent more heating degree days this winter than last winter, on a population-weighted basis. This would still be 1.5 percent below the 10-winter average, but does suggest that distillate demand could be higher this winter than last. The December through February outlook from NOAA calls for equal chances for above or below-normal temperatures in the Midwest (read as likely near-normal) but with chances leaning towards above-normal temperatures on the East Coast.
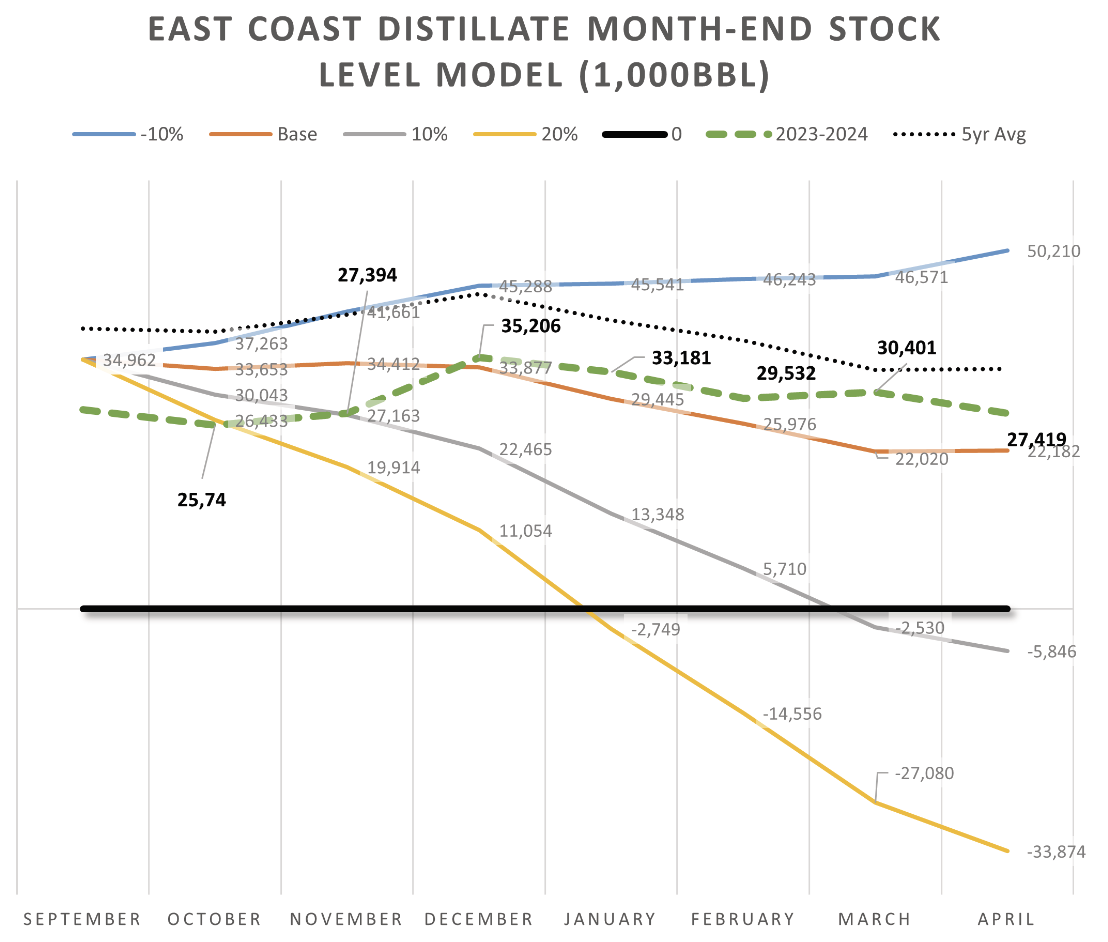
We now have all the pieces to the puzzle and can project the path of East Coast Distillate inventories for this winter. As a starting value, we will use the latest data point available at the time of this writing (35.41mb as of August 30) and apply the five-year average stock change for the month of September (-0.45mbd), which gives us an October 1 starting point of 34.96mb. Inventories are projected to be significantly higher than they were last year, but still at a deficit to the five-year average. The orange line represents our base case, and if we stress the model by increasing or decreasing implied demand, we can simulate the impact of a warmer or colder winter. We can see that if the market were static (it isn’t, but this is still a useful abstraction), we could start to run into trouble in January or February if we got some cold temperatures, but that there is no danger of low inventories in the base scenario. As we discussed above, crack spreads indicate we could see lower production this winter, and in combination with the higher expected degree days, this could negate some of the impact of the larger projected inventory cushion that we look set to have this year, putting us on a path somewhere between the orange (base) and gray (10 percent colder) scenarios. That means basis risks are likely to be elevated compared to the five-winter average, and while they appear lower than last year, they may be higher than one would think based on just looking at storage levels. That said, whether an event that produces a blowout will actually occur is anyone’s guess.
Dan Lothrop is Head Trader at over-the-counter derivatives company Northland Energy Trading LLC. He can be reached at 800-709-2949 or daniel@hedgesolutions.com.
The information provided in this market update is general market commentary provided solely for educational and informational purposes. The information was obtained from sources believed to be reliable, but we do not guarantee its accuracy. No statement within the update should be construed as a recommendation, solicitation or offer to buy or sell any futures or options on futures or to otherwise provide investment advice. Any use of the information provided in this update is at your own risk.
