Limited Heat Pump Adoption, Strong Oil Production Through 2050
The U.S. Energy Information Administration (EIA) released its “Annual Energy Outlook 2023” (AEO2023) on March 16, with a comprehensive launch webinar and a web presence complete with a detailed, descriptive narrative for each test case and resulting forecast.
News reports about the findings have been taken directly from from the presentation highlights:
- “Energy-related CO2 emissions fall 25% to 38% below 2005 levels by 2030.”
- “Renewable generating capacity grows across the United States”
- “U.S. to remain a net exporter of petroleum products through 2050”
- “Technological advancements and electrification drive decreases in demand-side energy intensity”
There’s one point that was not in the highlights, that is of great interest to Oil & Energy readers:
• Residential Electric Heat Pumps Market Share Increases by Less than 4% through 2050
According to the AEO2023, despite the tax credits for heat pumps in the Inflation Reduction Act (IRA) and other federal and non-federal incentives for homes and businesses to convert to electric heating, market share only increases from 11% of households in 2022 to between 14% and 15% in 2050.
The AEO2023 report specifically reviewed heat pump market share against natural gas-fired equipment, but its determination of the reasons behind the low adoption rate is just as relevant to the liquid heating fuels market.
- A large existing market share for non-heat pump equipment that lasts a long time
- The high cost of purchasing and switching technologies, including electrical upgrades to accommodate electric heating and cooling and new ductwork when replacing boilers
- The higher price of electricity versus natural gas per million British thermal units, despite heat pump efficiency that may be multiple times higher than fossil fuel-fired equipment
- Reduced overall demand for space heating as building efficiency improves and heating degree days decrease”
Residential Liquid Fuel Consumption
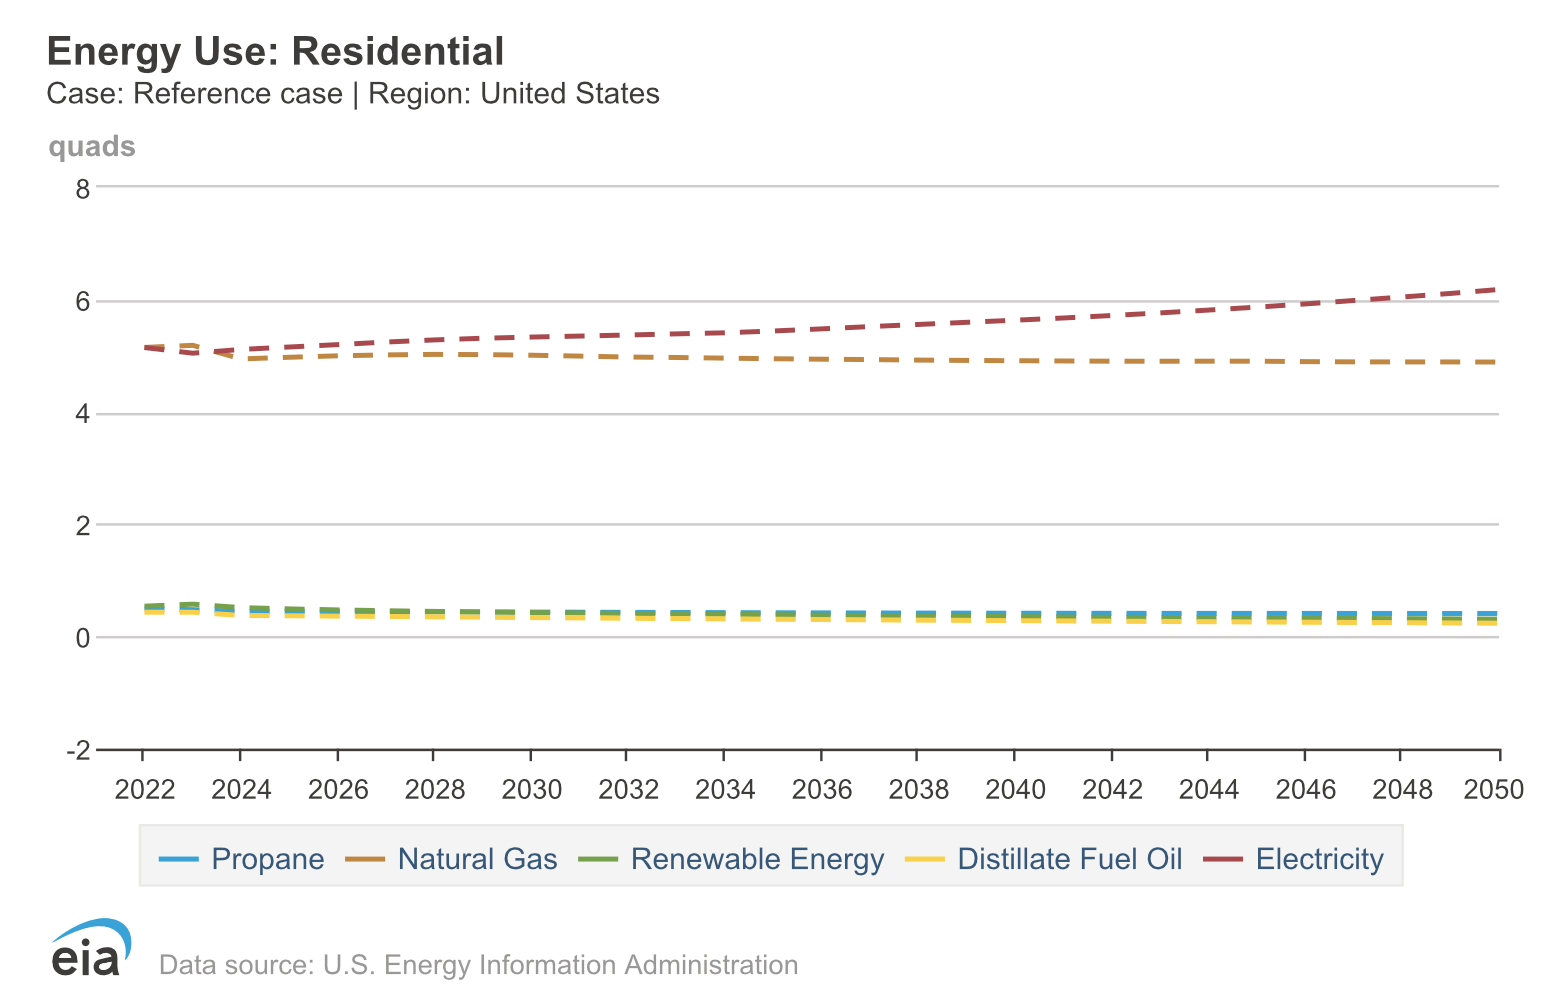
On the graph of residential consumption comparing Propane, Distillate Fuel Oil, Natural Gas, Renewable Energy and Purchased Electricity, the results appear relatively flat, with a small uptick from 5.15 (quads) in 2022 to 6.18 in 2050. At this scale, the other fuels appear unchanged.
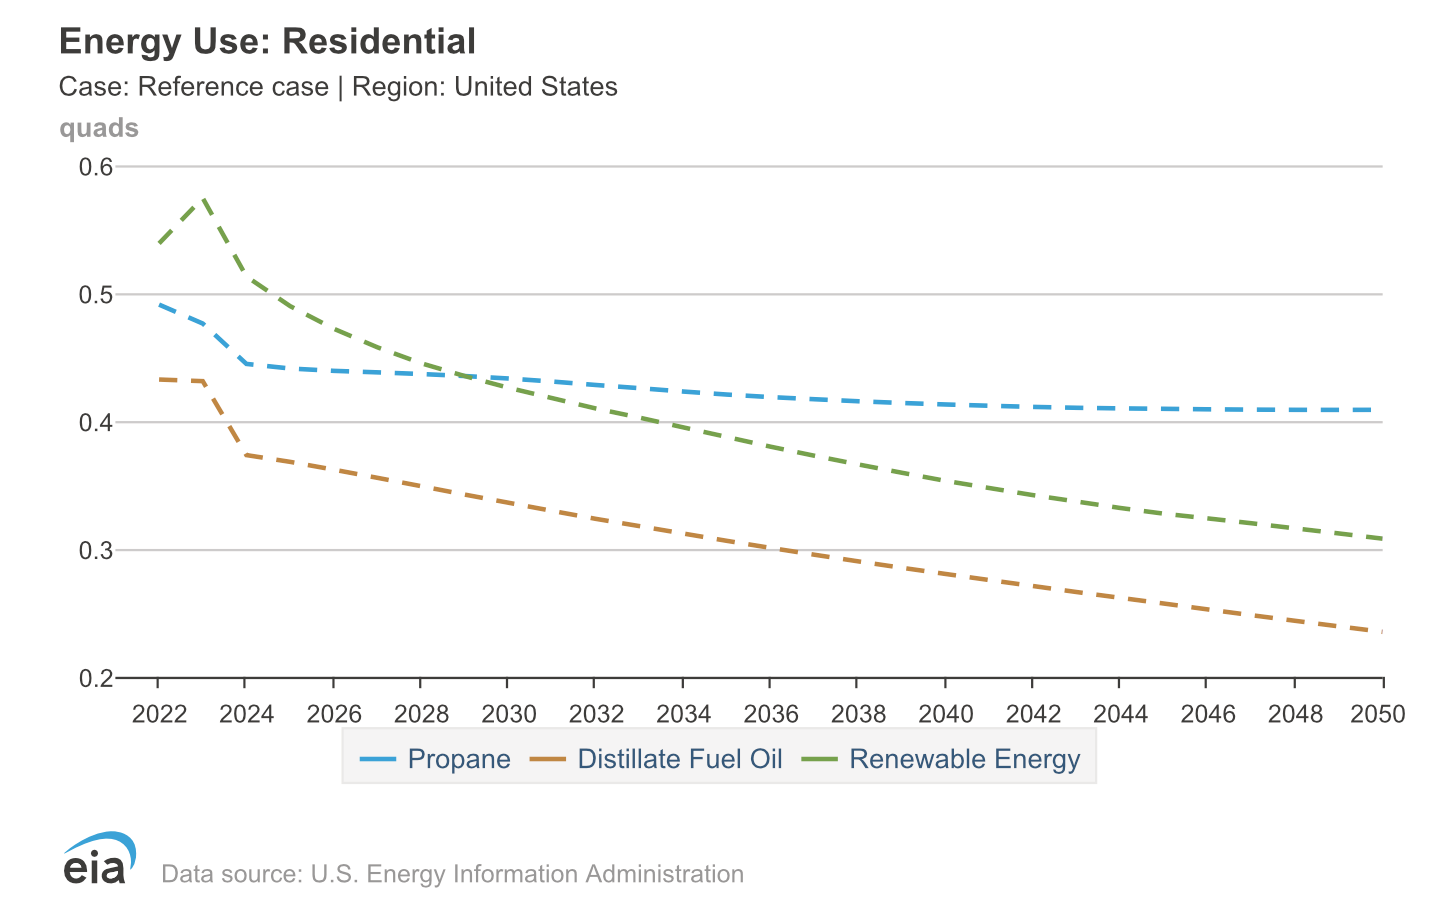
Perspective is everything, and removing electricity and natural gas from the calculations show that even apparently modest changes can make a big difference in the markets. In 2022, residential distillate fuel consumption was 0.43 quads, in 2050, 0.24. Similarly, propane consumption dropped from 0.49 to 0.41 and renewable energy from 0.54 to 0.31.
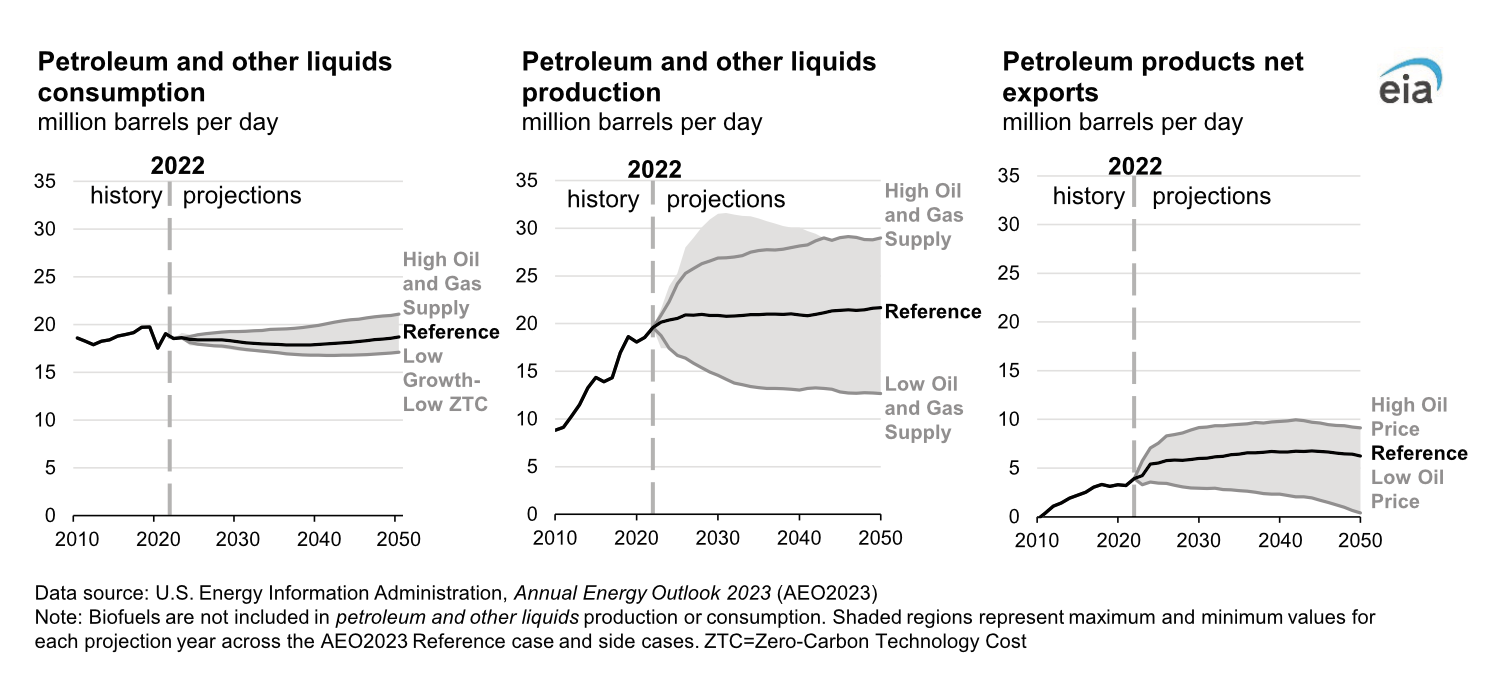
Petroleum Consumption and Production
U.S. petroleum consumption is expected to remain relatively flat through 2040, and then see modest increases to 2050. The EIA’s reference case estimated Brent Crude at $101 per barrel in 2050 and at $51/b and $190/b for their “Low” and “High” price calculations. Despite minimal changes in consumption, the reference and “high” scenarios see substantial growth in petroleum production and net exports. International demand for finished petroleum products keeps exports high and refineries competitive. Refinery capacity utilization is anticipated to remain as high as 90% or higher under the most favorable conditions.
The AEO2023 projections reflect the current ban on petroleum imports from Russia, but assumes equivalent imports from other countries will substitute for U.S. crude oil imports and minimize the sanctions’ effects on domestic markets.
Liquid Natural Gas
Export demand for liquid natural gas is expected to drive natural gas production, especially in areas with better access to terminals, as in the Southwest and Gulf Coast. AEO2023 notes a weakening in the historical correlation of international natural gas and oil prices due to the growth of market based-LNG, but anticipates that oil prices will continue to affect LNG export capacity and overall export levels.
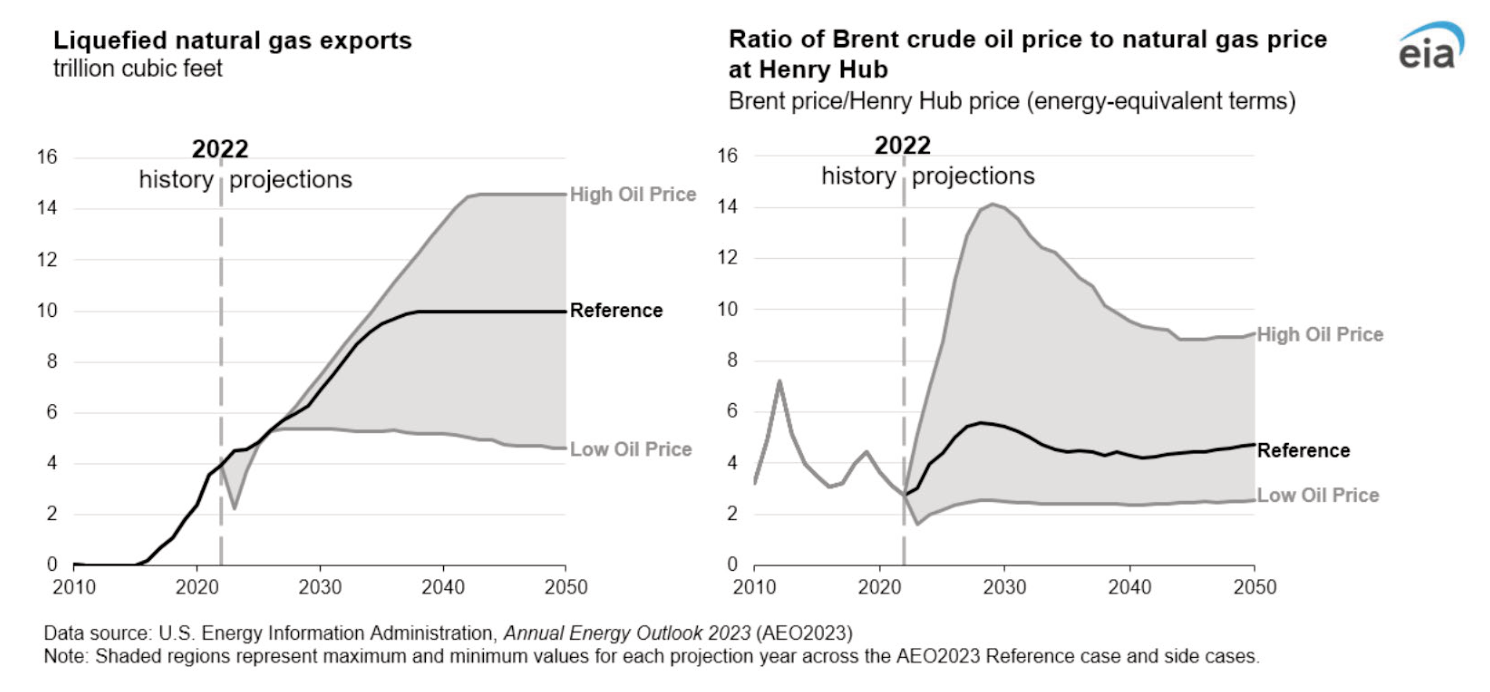
“When the Brent price is high relative to the U.S. Henry Hub price, like in the High Oil Price case, building more LNG export capacity and exporting LNG are more economical than when the Brent price is lower relative to Henry Hub. In the Low Oil Price case, the Brent price is lower, and the Henry Hub price is higher, which curtails LNG exports to below current volumes in the near term and causes LNG capacity to be underutilized near the end of the projection period.”
More Results: Carbon Dioxide Emissions
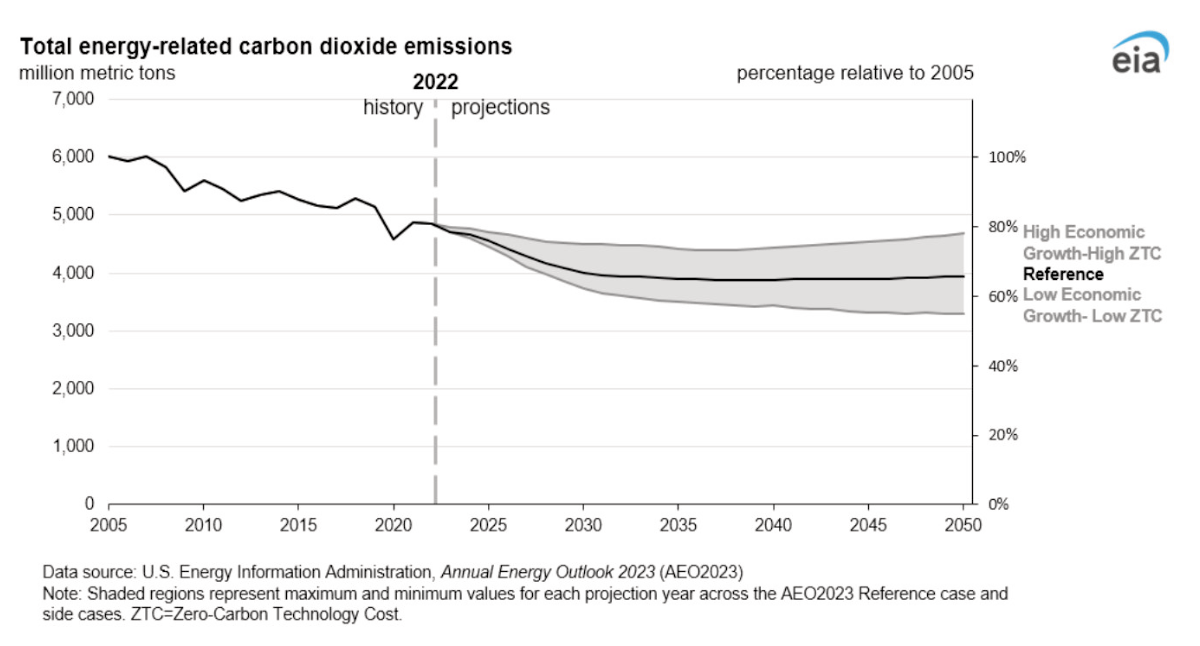
Energy related CO2 emissions are forecast to drop 25% to 38% below the 2005 level by 2030. This is well below the Paris Agreement target of 50-52% for the full nationally determined contribution (NDC), however, AEO2023 does not cover the full NDC scope. It also does not include all the provisions for electrification use and adoption in the IRA, as implementation details are not available.
The lower energy-related CO2 emissions are driven by increased electrification and improvements in equipment efficiency and renewable technologies for energy generation. At the same time, AEO2023 reports that “emissions reductions are limited by longer-term growth in U.S. transportation and industrial activity.”
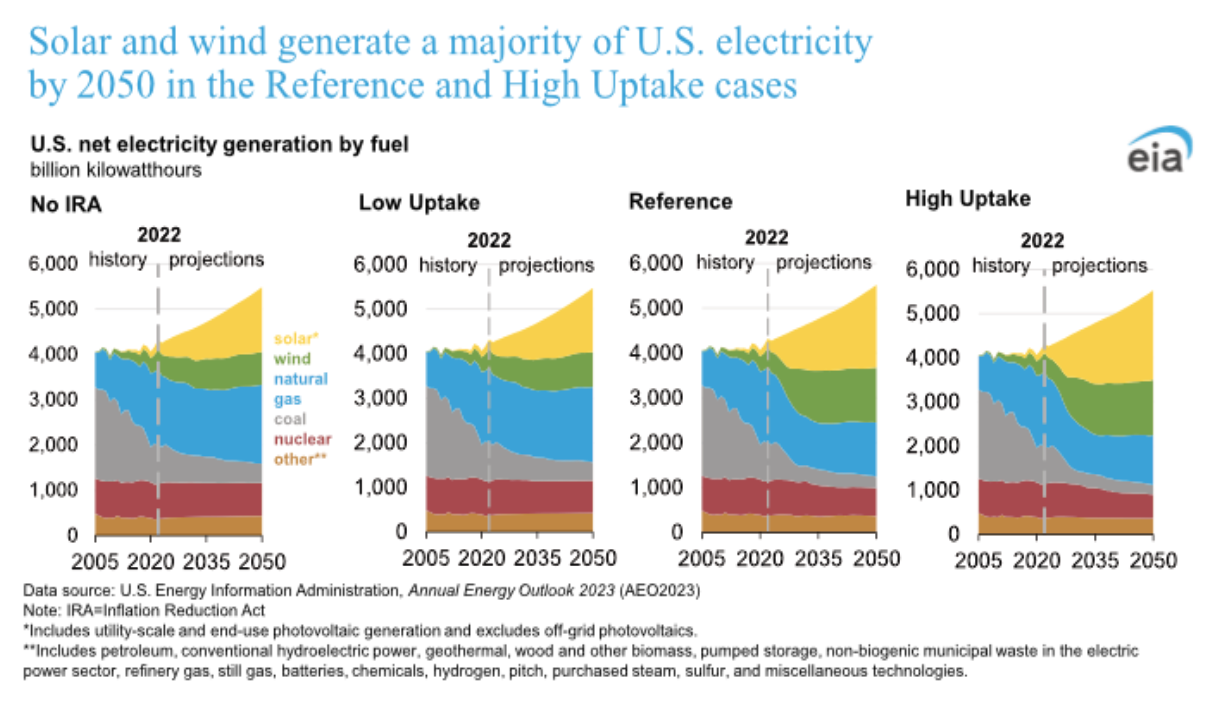
Electricity and Renewables
As electric demand increases, so does renewable generating capacity, led by solar.
Solar generating capacity grows by about 325% to 1019% by 2050, compared to 2022, and wind generating capacity by 138% to 235%. This growth in renewables is supported by expansion of installed battery capacity in all cases. At the same time, AEO2023 sees natural gas generation capacity increasing as much as 87% through 2050.