
Annual Energy Outlook projects COVID-19’s lasting impacts on domestic energy market
The U.S. Energy Information Administration (EIA) has released its Annual Energy Outlook (AEO2021), with projections for the domestic energy market through 2050.
As always, the outlook outlines multiple cases, each of which has different underlying assumptions. The central set of assumptions, or the “Reference case,” projects there will be improvement in known energy production, delivery and consumption technologies.
The complete AEO2021, available on the EIA website at eia.gov/outlooks/aeo, includes the following side cases: the High Oil Price and Low Oil Price cases, High Economic Growth and Low Economic Growth cases, and the High Renewables Cost and Low Renewables Cost cases. For brevity’s sake, this article focuses primarily on the Reference case.
Notably, the Reference case assumes that current laws and regulations that affect the energy sector remain unchanged throughout the projection period. With recent executive orders calling for drastic changes to the domestic energy mix, it seems unlikely that current laws and regulations will remain unchanged through 2021, let alone through 2050.
Nonetheless, AEO2021 provides a valuable window to the future based on modeled projections rather than speculative predictions. Reviewing these projections enables liquid heating fuel stakeholders to consider their individual business operations, as well as the overall position of their industry, within the larger context of the domestic energy mix.
This year, Oil & Energy has taken several steps to curate EIA’s AEO2021 narrative specifically for the liquid heating fuel industry audience. Though none of the text or charts from the EIA document has been substantially altered, the information has been reordered and broken down by bolded chapters (each containing EIA’s italicized subheadings). We hope this will make AEO2021 more understandable than past years’ reports and make clearer its relevance to Oil & Energy readers’ interests.
EIA’s Key Takeaways
Returning to 2019 levels of U.S. energy consumption takes years; energy related carbon dioxide emissions fall further before leveling off or rising
- Energy consumption fell faster than gross domestic product in 2020, and the pace at which both will return to 2019 levels remains uncertain.
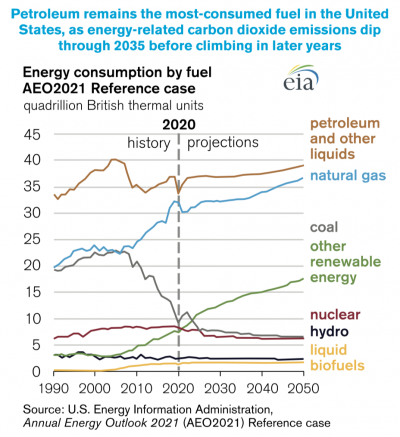
- Petroleum remains the most-consumed fuel in the United States, as energy-related carbon dioxide emissions dip through 2035 before climbing in later years.
- The energy intensity of the U.S. economy continues to fall as end-use sector intensities decline at varying rates.
Renewable energy incentives and falling technology costs support robust competition with natural gas as coal and nuclear power decrease in the electricity mix
- Electricity demand grows at a modest rate throughout the projection period.
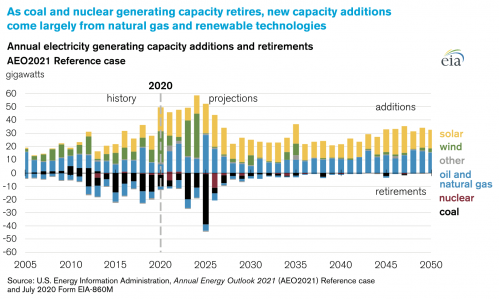
- As coal and nuclear generating capacity retires, new capacity additions come largely from natural gas and renewable technologies.
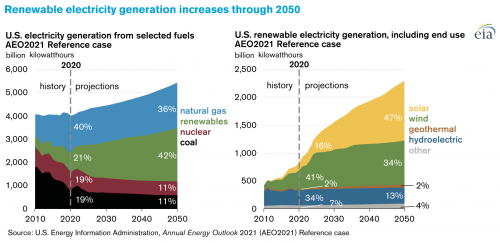
- Renewable electricity generation increases more rapidly than overall electricity demand through 2050.
- The cost-competitiveness of solar photovoltaic and natural gas combined-cycle units leads to capacity additions.
Continuing record-high domestic energy production supports natural gas exports but does not necessarily mean growth in the U.S. trade balance in petroleum products
- Amid uncertainty, the United States continues to be an important global supplier of crude oil and natural gas.
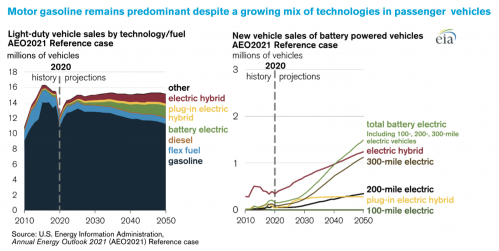
- Motor gasoline remains predominant despite a growing mix of technologies in passenger vehicles.
- Natural gas consumption growth between 2020 and 2050 is concentrated in two areas: exports and industrial use.
- The amount of crude oil processed at U.S. refineries decreased in 2020 because of lower demand for transportation fuels, but it returns to 2019 levels by 2025.
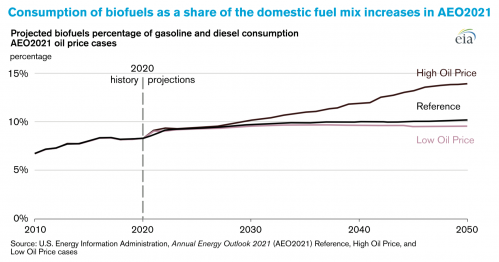
- Consumption of biofuels as a share of the domestic fuel mix increases in AEO2021.
The COVID Effect
Energy consumption fell faster than gross domestic product in 2020, and the pace at which both will return to 2019 levels remains uncertain
- The 2020 downturn in the U.S. economy stems from a series of demand shocks, both direct and indirect, that have resulted in large part from responses to the COVID-19 pandemic. Demand for energy delivered to the four U.S. end-use sectors (residential, commercial, transportation, and industrial) decreased to 90% of its 2019 level in 2020; a steeper decline than seen in real GDP.
- Compared with the financial crisis of 2008, the COVID-19-related decline in the total demand for delivered energy is about 70% larger. EIA projects that U.S. energy demand takes until 2029 to return to 2019 levels.
- Projections in AEO2021 focus on key factors driving longer-term demand for energy: growing economy and population; increasing use of renewables; increasing consumption of natural gas and electricity; and changing technology, behavior, and policy that affects energy efficiency in vehicles, end-use equipment, and lighting. These factors extend beyond the uncertainty resulting from the COVID-19 pandemic.
Energy consumption in buildings is least affected
- Consumption of energy in commercial buildings declined in 2020, resulting in the largest single-year decline in buildings sector delivered energy consumption since 2012. However, energy consumption in commercial buildings returns to 2019 levels by 2025.
- Commercial and residential energy intensities — the ratio of delivered energy consumption to floor space or building counts — suggest shifts in demand from increased working from home and videoconferencing in 2020 compared with 2019, although the increase in demand for energy by the residential sector is tempered by lower space heating needs resulting from a relatively warm 2019-2020 winter.
- Consumption of energy in residential buildings remains stable through the short term because working from home is moderating the effects of the economic downturn. Although energy consumption grows more slowly in residential buildings than in any other end-use sector between 2020 and 2050, increases in residential demand for cooling and electronic equipment offset efficiency improvements in many types of equipment, resulting in small increases in delivered energy consumption.
Responses to the pandemic decreased energy consumption in the transportation sector more than in the other end-use sectors
- Energy consumption in the transportation sector remains lower than its 2019 level for the entire projection period because travel greatly decreased in 2020 as a result of lockdowns, and assumed improvements in fuel economy offset projected resumed travel growth. Responses to the COVID-19 pandemic including mobility restrictions, limitations on nonessential travel, and increased working from home greatly reduced long- and short-distance U.S. travel demands in 2020 compared with 2019.
- U.S. passenger air travel demand decreases by nearly two-thirds in 2020 and returns in 2025 to 2019 levels; bus passenger travel demand decreases by nearly half in 2020 and returns in 2031 to 2019 levels; and light-duty vehicle (LDV) travel returns to 2019 levels by 2024.
- As rising economic activity results in increased travel demands that surpass 2019 levels, energy consumption in aviation (excluding military use) to move passengers and goods across the world returns to its 2019 levels by 2030. However, energy consumption by light-duty and heavy-duty vehicles remains lower than 2019 levels for the entire projection period. Although travel demands increase for most modes, assumptions of increasing fuel efficiency slow growth in energy consumption.
- Energy consumption decreases because of the market-based adoption of energy efficiency technologies in new vehicles and the increasingly stringent federal fuel economy standards for new light-duty vehicles (through 2026) and heavy-duty vehicles (through 2027). Efficiency improvements fully offset the consumption growth from LDV travel growth through 2043 and partially offset the consumption growth from heavy-duty vehicle travel growth through 2036. Continued growth of on-road travel increases energy use later in the projection period because the travel demand for both light- and heavy-duty vehicles outpaces fuel economy improvements.
Industrial energy consumption is projected to return to 2019 levels more rapidly than in other sectors
- By 2025, industrial output in the United States returns to 2019 levels, although EIA projects that specific industries will return to 2019 levels at different rates. Industrial energy consumption also declined in 2020, but EIA projects it to return to its 2019 levels by 2023, which is even faster than output growth and yields an increase in energy intensity in the near term.
- The U.S. industrial sector consumes more energy than any other end-use sector, and its energy use is projected to grow nearly twice as fast as any other end-use sector between 2020 and 2050. Metal-based durables, primary metals, and refining, all sensitive to net exports, contributed significantly to the 2020 decline in delivered energy consumption, while energy-intensive manufacturing and non-manufacturing industries drive the return to 2019 levels.
Biofuels’ Boons
Biofuels consumption decreases less than petroleum consumption
Although response to the COVID-19 pandemic affected demand for all liquid fuels in 2020, biofuel consumption has not decreased as much as petroleum-based fuels. AEO2021 shows biofuels production returning to 2019 levels in 2021, slightly faster than petroleum-based transportation fuels (motor gasoline and diesel), contributing to an increasing share of biofuels in the domestic fuel mix.
Biofuels consumption is supported by regulation
Biofuels consumption returns to 2019 levels faster than petroleum-based fuels mainly because of regulatory support, such as the federal Renewable Fuel Standard (RFS) program, which is administered by the U.S. Environmental Protection Agency (EPA) and is used to set annual U.S. renewable fuel volume targets. In the model, the RFS is a minimum level that must be met, so even when total transportation fuel demand drops, the RFS still requires a certain level of renewable fuel. State policy such as California’s Low Carbon Fuel Standard (LCFS) is also designed to encourage domestic biofuels production.
Biofuels use increases as a share of the total fuel mix
- EIA projects that the percentage of biofuels (including, ethanol, biodiesel, and other biomass) blended into the U.S. fuel pool (gasoline and diesel) will increase and slowly grow across the entire projection period.
- In the High Oil Price case, the share of biofuels consumed in the United States rises to a greater percentage as higher prices for gasoline and diesel make biofuels more competitive.
- The share of biofuels in the Low Oil Price case remains relatively unchanged when compared with the Reference case because of regulations like those previously mentioned. For example, the LCFS encourages the use of biomass-based diesel because renewable diesel has one of the lowest carbon intensities of the approved pathways for LCFS compliance.
Biofuel Supplies
- Biomass-based diesel, for the most part, tracks overall diesel demand. Biomass-based diesel is supported by policy including the renewed biodiesel mixture tax credit, and so it is likely to continue to gain market share through 2050. EIA projects diesel demand to almost return to pre-COVID levels in 2021, but never quite reach 2019’s peak. EIA expects biodiesel to grow slightly, maintaining a steady level of production through 2050.
- Several new renewable diesel plants have been announced this year, both domestically and overseas. A few domestic refineries have shuttered to convert to renewable diesel production, or they have made plans to do so in the near future, contributing to projected increases in renewable diesel supply.
- Because almost all finished motor gasoline sold in the United States is blended with 10% ethanol (E10), reductions in gasoline demand have driven similar decreases in fuel ethanol demand, and, correspondingly, fuel ethanol production. Consumption of both ethanol and gasoline in 2020 have dropped by more than 10%, and both return in 2021 to almost reach 2019 levels at a similar pace.
- After this near-term return to 2019 levels, motor gasoline and diesel follow a pattern of general decrease, never fully returning to pre-COVID levels. On the other hand, ethanol does return to pre-COVID levels in the later years of the projection period, steadily growing through 2050 because of higher ethanol blends making their way into the on-road transportation pool.
The majority of new vehicles are powered by liquid fuels
Spurred by rising incomes, increases in employment rates, and population growth, total annual sales of new light-duty vehicles (LDVs) in the United States increase after the 2020 economic downturn before leveling off after 2025. EIA projects fewer sales of new LDVs in every year in the projection period than in 2019, although the market continues to grow for alternative technologies, particularly battery electric vehicles (BEVs). Gasoline and flex-fuel vehicles — which may use gasoline blended with up to 85% ethanol — accounted for 95% of the new LDV market in 2020, but their share of new-vehicle sales decreases to 79% in 2050. Both BEVs and electric hybrids increase their market shares of annual new LDV sales.
Electricity demand in transportation remains low
Although the greatest potential for increased electricity demand is within the transportation sector, electricity demand from this sector remains less than 3% of economy-wide electricity demand throughout the projection period. Current laws and regulations are not projected to induce much market growth, despite continuing improvements in electric vehicles (EVs) through evolutionary market developments. Both vehicle sales and utilization (miles driven) would need to increase substantially for EVs to raise electric power demand growth rates by more than a fraction of a percentage point per year.
Petroleum Persists
Vehicles and industrial processes are the main petroleum consumers
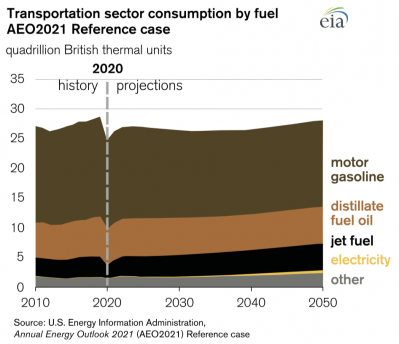
- Petroleum and other liquids remain the most-consumed fuel in AEO2021. The transportation sector is the largest consumer of petroleum and other liquids, particularly motor gasoline and distillate fuel oil.
- EIA assumes that current fuel economy standards stop requiring additional efficiency increases in 2026 for light-duty vehicles and in 2027 for heavy-duty vehicles. As travel continues to increase, consumption of petroleum and other liquids increases later in the projection period.
- For industrial uses, petroleum remains the primary fuel for refining processes and for agriculture.
The amount of crude oil processed at U.S. refineries decreased in 2020 because of lower demand for transportation fuels, but it returns to 2019 levels by 2025
- As people stayed home and avoided nonessential travel during the pandemic, domestic (and global) demand for transportation fuels in 2020 decreased. Weekly U.S. consumption estimates for motor gasoline in particular recorded their lowest levels since January 1994. In response, U.S. refineries altered their operations to adjust to less end-use product demand, and total refinery throughput decreased in 2020.
- Beginning in late March of 2020, because of responses aimed at slowing the spread of COVID-19, throughput, or the amount of crude oil processed at refineries refinery yields for liquid fuels began to fall, as did refinery utilization. Crude oil throughput decreased in 2020. However, total refinery throughput returns to pre-COVID levels in about 2025, and utilization returns to pre-COVID levels sooner because of the permanent closures of some refining capacity.
Petroleum Trade
- In addition, refineries have lower capacity as a result of several closures and conversions of refineries in 2020. This factor puts further downward pressure on total crude processing, resulting in less petroleum product and more crude to be exported. The projected increase in domestic crude oil production, recovery in global liquid fuels demand, and increase in U.S. refinery inputs means the U.S. returns to net petroleum exporter status, on a volume basis, by 2024.
- In the Reference case, the United States is both an importer and exporter of petroleum liquids, importing mostly heavy crude oil and exporting mostly petroleum products such as gasoline and diesel. Even though product exports in 2020 were lower than previous years, AEO2021 projects relatively high levels of exports for petroleum and other liquids exports through 2050.
- These high export levels are primarily a result of less consumption of liquid fuels in the United States and, to a lesser extent, because of domestic production of crude oil that cannot be processed economically domestically and is more valuable when exported. Net exports of petroleum and other liquids hold steady and stay in a similar range for the rest of the projection period.
Renewable Electricity Displaces Natural Gas
Renewable technologies account for the majority of the projected capacity additions
- Renewable electric generating technologies account for almost 60% of the approximately 1,000 gigawatts of cumulative capacity additions projected from 2020 to 2050. The large share is a result of declining capital costs but is also a result of increasing renewable portfolio standard (RPS) targets and tax credits. Although wind contributes to renewable electric generating capacity additions, it is on a much smaller scale compared with solar capacity, which builds steadily throughout the projection period.
- The share of natural gas in the generation mix remains flat, hovering at about one-third from 2020 to 2050. The share remains the same even though natural gas prices remain low (at or lower than$3.50 per million British thermal units) for most of the projection period, despite significant coal and nuclear generating unit retirements resulting from market competition, as regulatory and market factors induce more renewable electric generation.
Renewable electric generation is used to meet an increasing share of additional demand
- As the share of natural gas-fired generation remains relatively flat, and as the contribution from the coal and nuclear fleets drops by half, the renewables’ share of the electricity generation mix more than doubles from 2020 to 2050. Wind is responsible for most of the growth in renewables generation from 2020 through 2024, accounting for more than two-thirds of those increases in electricity generation during that period.
- After the production tax credit (PTC) for wind phases out at the end of 2024, solar generation is responsible for almost three-quarters of the increase in renewables generation. EIA assumes solar receives a 30% investment tax credit (ITC) through 2023, which is then reduced to a permanent value of 10% in 2024 and forward.
As more solar and wind energy is integrated into the electricity grid, natural gas-fired generating unit capacity factors steadily decrease
- As a result of faster growing natural gas-fired generating capacity than natural gas-fired generation from 2020 to 2050, capacity factors for natural gas units decline steadily across all plant technology types. As more wind and solar capacity is added that displaces generation from both existing and new natural gas-fired generators, capacity factors for existing combined-cycle units will drop by nearly half from a peak of 60% in 2020.
- Natural gas accounts for over 40% of cumulative capacity additions from 2020 to 2050. About half of these additions are low-utilization combustion turbines, which are economically attractive when mostly used to provide infrequent peaking capacity. Energy storage systems, such as stand-alone batteries or solar/battery hybrid systems, are used as an arbitrage tool to move solar and other generation from periods of high supply and low demand to periods of low supply and high demand.
