
The U.S. Energy Information Administration (EIA) has released its Annual Energy Outlook 2020 (AEO2020), with projections for the domestic energy market through 2050.
As always, the outlook outlines multiple cases, each of which has different underlying assumptions. The central set of assumptions, or the “Reference case,” projects there will be improvement in known energy production, delivery, and consumption technologies.
Notably, the Reference case also assumes that current laws and regulations affecting the energy sector, including laws that have end dates, remain unchanged through the projection period. The potential effects of proposed legislation, regulations, or standards are not included in AEO2020. If those effects were included, the projections would likely be very different.
In addition to the Reference case, AEO2020 includes the following side cases:
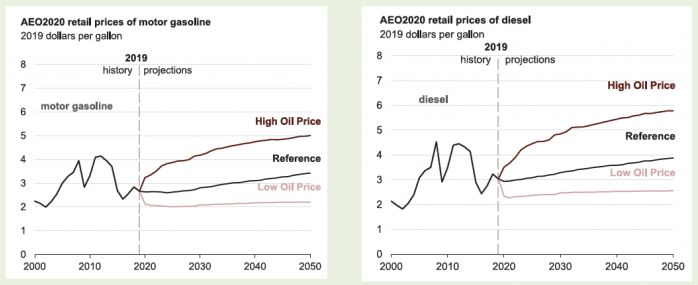
• In the High Oil Price case, the price of Brent crude oil, in 2019 dollars, reaches $183 per barrel (b) by 2050, compared with $105/b in the Reference case.
• In the Low Oil Price case, the Brent crude price in 2050 is $46/b.
• The High Oil and Gas Supply case reflects lower costs and greater U.S. oil and natural gas resource availability, which allows more production at lower prices.
• The Low Oil and Gas Supply case assumes fewer resources and higher costs.
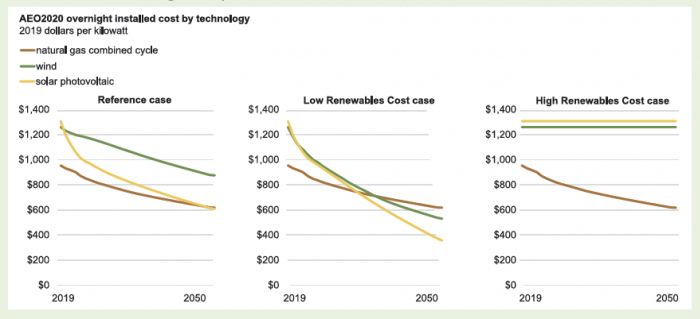
• AEO2020 introduces two cases to examine the sensitivities surrounding capital costs for electric power generating technologies. Capital cost reduction for an electric power generating technology is assumed to occur from learning by doing. In the High Renewables Cost case, no cost reduction from learning is assumed for any renewable technologies. The Low Renewables Cost case assumes higher learning for renewable technologies through 2050, resulting in a cost reduction of about 40% from the Reference case by 2050. (See page 28 for related projections.)
Also worth mentioning at the start: for the first time since 2016, the outlook dedicates an entire subsection to biofuel projections.
The United States becomes a net energy exporter on an annual basis by 2020, but the United States continues to import and export energy throughout the projection period.
• The United States imported more energy than it exported annually since 1953, but continued growth in petroleum and natural gas exports results in the United States becoming a net energy exporter in 2020 in all AEO2020 cases.
• In the AEO2020 Reference case, the United States exports more petroleum and other liquids than it imports annually starting in 2020 as U.S. crude oil production continues to increase and domestic consumption of petroleum products decreases. Near the end of the projection period, the United States returns to importing more petroleum and other liquids than it exports on an energy basis as a result of increasing domestic gasoline consumption and falling domestic crude oil production after 2047.
• The United States became a net natural gas exporter on an annual basis in 2017 and continued to export more natural gas than it imported in 2018 and in 2019. In the AEO2020 Reference case, liquefied natural gas (LNG) exports to more distant destinations will increasingly dominate the U.S. natural gas trade, and the United States is projected to remain a net natural gas exporter through 2050.
Production of U.S. crude oil and natural gas plant liquids continues to grow through 2025, and natural gas plant liquids comprise nearly one-third of cumulative U.S. liquids production during the projection period.
• In the AEO2020 Reference case, U.S. crude oil production reaches 14.0 million barrels per day (b/d) by 2022 and remains near this level through 2045 as tight oil development moves into less productive areas and well productivity declines.
• The continued development of tight oil and shale gas resources in the AEO2020 Reference case supports growth in natural gas plant liquids (NGPL) production, which reaches 6.6 million b/d by 2028. NGPLs are light hydrocarbons predominantly found in natural gas wells and are diverted from the natural gas stream by natural gas processing plants. These hydrocarbons include ethane, propane, normal butane, isobutane, and natural gasoline.
• In the AEO2020 Reference case, NGPL production grows by 26% during the projection period as a result of demand increases by the global petrochemical industry. Most NGPL production growth in the AEO2020 Reference case occurs before 2025 as producers focus on natural gas plant liquids-rich plays, where NGPL-to-gas ratios are highest and increased demand spurs greater ethane recovery.
• In the AEO2020 cases, NGPL production is sensitive to changes in resource and technology assumptions, as well as oil price assumptions. In the High Oil and Gas Supply case, which has faster rates of technological improvement, higher recovery estimates, and additional tight oil and shale gas resources, NGPL production grows by 61% during the projection period. In the High Oil Price case, high crude oil prices lead to more drilling in the near term, but cost increases and fewer easily accessible resources decrease production of crude oil and NGPLs later in the forecast period.
Tight oil development drives U.S. crude oil production.
• Onshore tight oil development in the Lower 48 states continues to be the main driver of total U.S. crude oil production, accounting for about 70% of cumulative domestic production in the AEO2020 Reference case during the projection period.
• In the AEO2020 Reference case, deepwater discoveries of oil and natural gas resources in the Gulf of Mexico lead offshore production in the Lower 48 states to reach a record 2.4 million b/d in 2026. Many of these discoveries occurred during exploration that took place before 2015, when oil prices were higher than $100 per barrel, and they are being developed as oil prices rise. Offshore production increases through 2035 before generally declining through 2050 as a result of new discoveries only partially offsetting declines in legacy fields.
• Alaska crude oil production generally increases through 2041, driven primarily by the development of fields in the National Petroleum Reserve–Alaska (NPR-A) before 2030, and after 2030, by the development of fields in the 1002 Section of the Arctic National Wildlife Refuge (ANWR). Exploration and development of fields in ANWR is not economical in the Low Oil Price case.
Biofuels as a percentage of gasoline, diesel, and jet fuel consumption increase, and biofuels adoption accelerates as biofuels become more competitive.
• EIA projects that the percentage of biofuels (ethanol, biodiesel, renewable diesel, and biobutanol) blended into U.S. gasoline, diesel, and jet fuel in the AEO2020 Reference case will increase from 7.3% in 2019 to peak at 9.0% in 2040.
• The share of biofuels consumed in the United States rises more in the AEO2020 High Oil Price case as higher prices for gasoline, diesel, and jet fuel make biofuels more competitive. In that case, the biofuels share rises to 13.5% in 2050.
• In the AEO2020 Low Oil Price case, the share of biofuels consumed in the United States is relatively unchanged compared with the Reference Case because of federal and state regulations. Regulations such as the Renewable Fuel Standard and Low Carbon Fuel Standard support biofuels consumption when prices of petroleum-based product are low and biofuels are less competitive.
Utilization of U.S. refineries remains near recent levels throughout the projection period as U.S. refineries remain competitive in the global markets, and U.S. exports of low-sulfur diesel and residual fuel oil increase in 2020 as a result of international sulfur emissions regulations on the marine sector.
• The share of U.S. refinery throughput that is exported increases in the AEO2020 Reference case as domestic consumption of refined products decreases, leaving more petroleum product available to export from 2020 to 2041. The trend reverses after 2041 when domestic consumption (especially of gasoline) gradually increases.
• The global competitiveness of the U.S. refining sector and the ability of the United States to increase exports as domestic consumption falls keep domestic refinery utilization near recent levels, between 90% and 93%, during the projection period in the Reference case.
• Imports of unfinished oils peak in 2020 as U.S. refineries take advantage of the increased discount of the heavy, high-sulfur residual fuel oil available on the global market. Exports of diesel and residual fuel (especially low-sulfur residual fuel) increase to 2.5 million barrels per day in 2020 because U.S. refineries are well-positioned to supply some of the increase in global demand for low-sulfur fuels as a result of the International Maritime Organization’s new limits on sulfur content in marine fuels.
The United States exports more petroleum on a volume basis than it imports from 2020 to 2050.
• In the AEO2020, strong production growth and decreasing domestic demand drive the United States to export higher volumes of crude oil and liquid fuels than it imports, resulting in growing levels of net exports from 2020 to 2033.
• In the AEO2020 Reference case, net exports of U.S. petroleum and other liquids peak at more than 3.8 million barrels per day (b/d) in the early 2030s before gradually declining as domestic consumption rises. The United States continues to export more petroleum and other liquids than it imports. Net exports of petroleum and other liquids reach 0.2 million b/d in 2050 as domestic consumption slowly increases but remains 1.2 million b/d below the peak levels recorded in 2004.
• Additional resources and higher levels of technological improvement in the AEO2020 High Oil and Gas Supply case result in more U.S. crude oil production and exports; net exports reach a high of 8.9 million b/d in the mid-2030s. Projected net exports reach a high of 9.6 million b/d in the mid-2020s in the High Oil Price case as a result of higher prices that support more domestic production.
• In the AEO2020 Low Oil Price case, by the mid-2020s, the United States exports 1.1 million b/d more than it imports before rising consumption leads the United States to become a net importer, importing 5.5 million b/d more than it exports in 2050.
• All AEO2020 cases except the Low Oil and Gas Supply and Low Oil Price cases project that the United States will export more petroleum and other liquids than it imports through 2050.
Prices for gasoline and diesel fuel rise throughout the Reference case projection period and primarily follow the price of crude oil in the High Oil Price and Low Oil Price cases.
U.S. dry natural gas production and consumption increase, and natural gas production growth outpaces consumption.
• Natural gas dry production in the AEO2020 Reference case grows 1.9% per year from 2020 to 2025, which is considerably slower than the 5.1%-per-year average growth rate from 2015 to 2020.
• U.S. natural gas consumption in the Reference case slows after 2020 and remains relatively flat through 2030 because of slower industrial sector growth. Consumption also declines in the electric power sector during this period. After 2030, consumption growth rises almost 1% per year on average as natural gas use in the electric power and industrial sectors increases.
• U.S. natural gas production grows at a faster rate than consumption in most cases after 2020, leading to an increase in U.S. exports of natural gas. The exception is in the AEO2020 Low Oil and Gas Supply case, where production and consumption remain relatively flat as a result of higher production costs.
Henry Hub natural gas prices remain lower than $4 per million British thermal units throughout the projection period.
• In the AEO2020 Reference case, growing demand in domestic and export markets leads to increasing natural gas spot prices at the U.S. benchmark Henry Hub through 2050 despite continued technological advances that support increased production.
• To satisfy the growing demand for natural gas, U.S. natural gas production expands into less prolific and more expensive-to-produce areas, putting upward pressure on production costs.
• Natural gas prices in the AEO2020 Reference case remain lower than $4 per million British thermal units (MMBtu) through 2050 because of an abundance of lower cost resources, primarily in tight oil plays in the Permian Basin. These lower cost resources allow higher production levels at lower prices during the projection period.
• The AEO2020 High Oil and Gas Supply case--which reflects lower finding, development, and production costs and greater resource availability--shows an increase in U.S. natural gas production and lower prices relative to the Reference case. In the Low Oil and Gas Supply case, high prices, which result from higher costs and fewer available resources, result in less domestic consumption and exports during the projection period.
Industrial and electric power demand drives U.S. natural gas consumption growth, but consumption in the residential and commercial sectors remains relatively flat across the projection period.
• Relatively low U.S. natural gas prices in the AEO2020 Reference case lead to continued growth in natural gas consumption in the near term, particularly in the electric power sector. However, through 2050, only the industrial sector shows markedly increased natural gas consumption.
• The industrial sector, which includes fuel used for liquefaction at export facilities and in lease and plant operations, consumes more natural gas than any other sector in the United States after 2021. Major natural gas consumers in this sector include the chemical industry (where natural gas is used as a feedstock to produce methanol and ammonia), manufacturing heat and power, and lease and plant fuel.
• Natural gas used for U.S. electric power generation peaks in 2021 as relatively low natural gas prices, new natural gas-fired combined-cycle capacity, and coal-fired capacity retirements drive increases in natural gas-fired generation in the short term. However, strong growth in renewables and efficiency improvements in the remaining coal-fired fleet lead to declining amounts of natural gas consumed in the electric power sector through 2030. Natural gas consumption then slowly rises to reach its 2021 level again in the late 2040s.
• Natural gas consumption in the residential and commercial sectors remains largely flat because of efficiency gains and population shifts to warmer regions that counterbalance population growth. Although natural gas consumption rises in the transportation sector—particularly for freight trucks, rail, and marine shipping—it remains a small share of both transportation fuel demand and total natural gas consumption.
The United States continues to export more natural gas than it imports, because near-term growth in liquefied natural gas export capacity delivers domestic production to global markets.
• In the AEO2020 Reference case, pipeline exports to Mexico and liquefied natural gas (LNG) exports to world markets increase moderately until 2025, after which pipeline export growth to Mexico slows. LNG exports continue to rise through 2030 before remaining relatively flat for the remainder of the projection period.
• Increasing natural gas exports to Mexico are a result of more pipeline infrastructure to and within Mexico, allowing for increased natural gas-fired power generation. By 2030, Mexico’s domestic natural gas production begins to displace U.S. exports.
• Three more LNG-export facilities became operational in the Lower 48 states in 2019, bringing the total number to six. Two new LNG projects reached final investment decisions and started construction in 2019. All LNG-export facilities and expansions currently under construction are expected to be completed by 2025. U.S. LNG-export capacity will continue to serve growing global LNG demand, particularly in emerging Asian markets as long as U.S. natural gas prices remain competitive. As U.S.-sourced LNG becomes less competitive in world markets after 2030, export volumes level off.
• U.S. imports of natural gas from Canada, primarily from its prolific western region, continue to generally decline from historical levels. U.S. exports of natural gas to eastern Canada continue to increase because of eastern Canada’s proximity to U.S. natural gas resources in the Marcellus and Utica plays and new pipeline infrastructure. However, this export growth slows in the mid-2020s as Canada’s demand for natural gas begins to decline, particularly in the electric power sector, as Canada begins transitioning to more renewables in its generation mix.
Electricity demand grows slowly through 2050, with increases occurring across all end-use sectors.
• Although near-term electricity demand may fluctuate as a result of year-to-year changes in weather, trends in long-term demand tend to be driven by economic growth offset by increases in energy efficiency. The annual growth in electricity demand averages about 1% throughout the projection period (2019-2050) in the AEO2020 Reference case.
• Historically, although the economy has continued to grow, growth rates for electricity demand have slowed as new, efficient devices and production processes that require less electricity have replaced older, less-efficient appliances, heating, ventilation, cooling units, and capital equipment.
• Average electricity growth rates in the AEO2020 High Economic Growth and Low Economic Growth cases vary the most from the Reference case. Electricity use in the High Economic Growth case grows 0.3 percentage points faster on average, and electricity use in the Low Economic Growth case grows 0.2 percentage points slower.
• The growth in projected electricity sales during the projection period would be higher if not for significant growth in generation from rooftop photovoltaic (PV) systems, primarily on residential and commercial buildings, and combined-heat-and-power systems in industrial and some commercial applications. By 2050, end-use solar photovoltaic accounts for 4% of U.S. generation in the AEO2020 Reference case.
• Electric power demand from the transportation sector is a very small percentage of economy-wide demand because electric vehicles (EVs) still represent a developing market. Given the lack of market evidence to date that would indicate a significant increase in U.S. consumer preference for EVs, EIA’s AEO2020 projections reflect the dependence of the EV market on regulatory policies. Both vehicle sales and utilization (miles driven) would need to increase substantially for EVs to raise electric power demand growth rates by more than a fraction of a percentage per year.
The High Renewables Cost and Low Renewables Cost cases assume different rates of cost reduction for renewable technologies compared with the Reference case; non-renewables assume the same rates.
Changes in cost assumptions for new wind and solar projects result in significantly different projected fuel mixes for electricity generation.
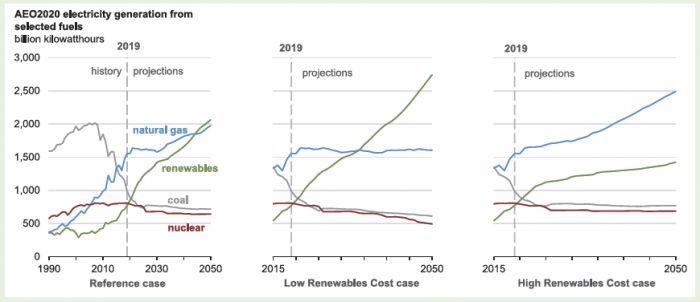
Declining costs for new wind and solar projects support the growing renewables share of the generation mix across a wide range of assumptions, although the results are sensitive to natural gas resource and price assumptions.
• Because of declining capital costs and higher renewable portfolio standards (RPS) targets in some states, AEO2020 projects that the relatively sharp growth in renewables seen during the past 10 years will continue through the projection period. Total renewable generation exceeds natural gas-fired generation after 2045 in the AEO2020 Reference case. Renewable generation grows faster than overall electricity demand.
• Although coal-fired and nuclear generation decline through the mid-2020’s as a result of retirements, generation from these sources stabilizes over the longer term as the more economically viable plants remain in service. At projected Reference case prices, natural gas-fired generation is the marginal fuel source to fulfill incremental demand and increases in the later projection years, averaging 0.8% growth per year through 2050.
• As a result of projected lower natural gas prices in the High Oil and Gas Supply case, natural gas-fired generation increases 1.9% per year through the projection period, reaching a 51% share of the generation mix by 2050. In contrast, under the projected higher natural gas prices in the Low Oil and Gas Supply case, natural gas-fired generation declines 1.4% per year through 2050, reaching a 19% share of the generation mix by 2050.
Expected requirements for new generating capacity will be met by renewables and natural gas as a result of competitive natural gas prices and declining costs for renewables.
• In the AEO2020 Reference case, the United States adds 117 gigawatts (GW) of new wind and solar capacity between 2020 and 2023, which is the result of tax credits, increasing RPS targets, and declining capital costs.
• New wind capacity additions continue at much lower levels after production tax credits expire in the early 2020s, but the growth in solar capacity continues through 2050 for both the utility-scale and small-scale applications because the cost of solar PV declines throughout the projection period.
• Natural gas-fired combined-cycle generation capacity is also added steadily throughout the projection period to meet rising demand.
• Most of the electric generation capacity retirements assumed in the AEO2020 Reference case occur by 2025. Although the final schedule will depend upon state-level implementation plans, in AEO2020 EIA assumes that coal-fired plants must either invest in heat rate improvement technologies by 2025 or retire to comply with the Affordable Clean Energy (ACE) rule. Heat rate improvement technologies increase the efficiency of power plants. The remaining coal plants are more efficient and continue to operate throughout the projection period. Low natural gas prices in the early years also contribute to the retirements of coal-fired and nuclear plants because both coal and nuclear generators are less profitable in these years.
Transportation energy consumption declines through the 2030s, because increases in fuel economy more than offset growth in vehicle miles traveled.
• Increases in fuel economy standards drive the decrease in U.S. motor gasoline consumption, which declines by 19% through 2050.
• Continued growth of on-road travel increases energy use later in the projection period because the travel demand for both light- and heavy-duty vehicles outpaces fuel economy improvements that result from regulatory requirements. Fuel efficiency regulations require no additional efficiency increases for new light-duty vehicles after 2025 and for new heavy-duty vehicles after 2027.
• Although increases in fuel efficiency standards slow growth in heavy-duty vehicle energy consumption and related diesel use, overall energy consumption for heavy-duty vehicles increases 4% through 2050 as a result of rising economic activity that increases demand for freight truck travel.
• Electricity is the fastest-growing energy source in the transportation sector, increasing on average 7.4% per year by 2050 as a result of increased demand for electric light-duty vehicles. Despite this growth, electricity accounts for less than 2% of transportation fuel consumption in 2050.
• Jet fuel consumption also increases through the projection period, rising 31% by 2050 because increases in air transportation outpace increases in aircraft fuel efficiency.
• Motor gasoline and distillate fuel oil’s combined share of total transportation energy consumption decreases from 84% in 2019 to 74% in 2050.
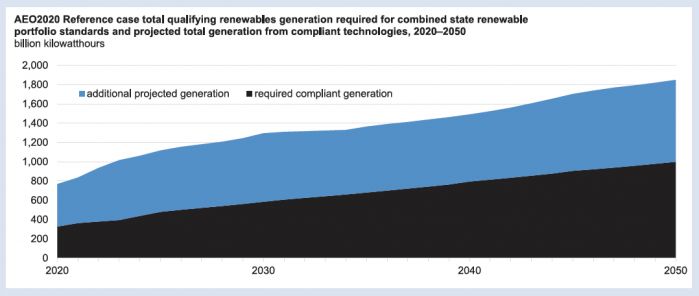
Even with recent increases in several states’ renewable portfolio standards, renewable generation that exceeds requirements allows for full compliance in the AEO2020 Reference case by 2050.
Alternative and electric vehicles gain market share, but gasoline vehicles remain the dominant vehicle type through 2050.
• The combined share of sales from gasoline and flex-fuel vehicles (which use gasoline blended with up to 85% ethanol) declines from 94% in 2019 to 81% in 2050 in the AEO2020 Reference case because of growth in sales of battery electric vehicles (BEV), plug-in hybrid electric vehicles (PHEV), and hybrid electric vehicles. BEV sales increase faster than any other type of vehicle sale, growing on average by 6% per year.
• Sales of the longer-ranged 200- and 300-mile BEVs grow during the entire projection period, tempering sales of the shorter-range 100-mile BEV and PHEV. Sales for the 200- and 300-mile BEVs increase from 280,000 in 2019 to 1.9 million in 2050, while sales of PHEVs increase from 137,000 in 2019 to 230,000 in 2050.
• Hybrid electric vehicle sales increase 3.1% per year, rising to more than 900,000 new vehicles sold by the end of the projection period.
• New light-duty vehicles of all fuel types show significant improvements in fuel economy because of compliance with increasing fuel economy standards. Light-duty vehicle fuel economy rises by 55% through the projection period.
Consumption of transportation fuels grows considerably in the AEO2020 Reference case through the projection period, because of increased use of electricity and natural gas.
• Electricity use in the transportation sector increases sharply after 2020 in the AEO2020 Reference case because of a rise in the sale of new battery-electric and plug-in hybrid-electric light-duty vehicles.
• Natural gas consumption increases through 2050 because natural gas is increasingly used as a fuel for heavy-duty vehicles and freight rail.
• In the later years of the projection period, liquefied natural gas is used in the maritime industry as an alternative to burning high-sulfur residual fuel oil to meet the new standards set for marine fuels under the International Convention for the Prevention of Pollution from Ships (MARPOL convention).
Residential and commercial energy consumption grows slowly, accounting for changes to energy efficiency standards and technological advances.
• Total delivered energy consumption in the U.S. buildings sector grows slowly through the AEO2020 Reference case projection period, 2019 to 2050, by 0.2% per year, as energy efficiency improvements, increases in distributed electricity generation, and regional shifts in the population partially offset the impacts of higher growth rates in population, number of households, and commercial floorspace.
• Purchased electricity consumption grows in both the residential and commercial sectors as a result of increased demand for appliances, devices, and equipment that use electricity. In the Reference case, purchased electricity increases by 0.6% and 0.8% per year in the residential and commercial sectors, respectively, through 2050.
• Natural gas consumption by commercial buildings grows by 0.2% per year through the projection period, led by increases in water heating and cooking. Consumption of natural gas in the residential sector falls by 0.3% per year as its use for space heating continues to decline.
• If not for the contribution of distributed generation sources, particularly rooftop solar, purchased electricity consumption in residential and commercial buildings would be 5% and 3% higher, respectively, by the end of the projection period.
As a result of population shifts, overall U.S. heating needs decrease and cooling needs increase.
• The number of U.S. households increases by an average of 0.6% per year in the AEO2020 Reference case through 2050, and single-family homes grow the fastest, at 0.7% per year. The stock of multifamily homes grows at a rate of 0.6% per year, while mobile home stocks decrease by 1.2% per year and are the only category EIA does not expect to grow.
• The size of housing units also continues to grow; the national average floorspace per home increases 0.3% per year from 1,786 square feet in 2019 to 1,987 square feet in 2050.
• Demand for space heating from fuels such as natural gas, distillate fuel oil, propane, and electricity decreases through 2050 as a result of fewer heating degree days (HDDs) — a measure of how cold a location is over a time period relative to a base temperature.
• Demand for space cooling from electricity increases through 2050 as a result of more cooling degree days (CDDs) — a measure of how warm a location is over a time period relative to a base temperature.
U.S. residential energy intensity decreases, although changes in electricity consumption vary by end use.
• In the AEO2020 Reference case, U.S. total delivered residential energy intensity, defined as annual delivered energy use per household, decreases by 17% between 2019 and 2050 as the number of households grows faster than energy use. The main factors contributing to this decline include gains in appliance efficiency, onsite electricity generation (e.g., solar photovoltaic), utility energy efficiency rebates, rising residential natural gas prices, lower space heating demand, and a continued population shift to warmer regions.
• As near-term appliance standards result in efficiency gains beyond those gains caused by market forces and technological change, electricity intensity declines before 2030 and then increases slightly as sector growth overtakes additional efficiency gains.
• Natural gas and electric equipment increasingly replace distillate fuel oil- and propane-fired equipment.
• Electricity intensity of other uses increases throughout the projection period with expected growth in the use of electronic equipment, such as security systems and rechargeable devices.
Residential and commercial electricity prices decline slightly through 2050, while natural gas prices rise, moderating natural gas consumption.
• AEO2020 Reference case electricity prices fall in the near term, primarily because utilities pass along savings from lower taxes under the Tax Cuts and Jobs Act of 2017. In addition, utilities are replacing more costly power plants with new plants that are less expensive to construct and operate, which also contributes to lower prices. Lower prices encourage more consumption in the near term in both sectors, although near-term efficiency standards and population shifts to warmer areas of the country moderate this trend.
• Natural gas prices in both the residential and commercial sectors increase steadily, by an average of 0.5% per year, in the Reference case through 2050. Increasing natural gas prices decrease consumption in the residential sector and moderate consumption growth in the commercial sector.
Energy consumption by fuel varies across energy-intensive industries, because some industries have greater capacity for fuel switching than others.
• Natural gas (used primarily for process heat) remains the primary fuel in the U.S. food and glass industries in the AEO2020 Reference case, although its share declines through 2050. In the food industry, the share of renewables grows from 14% in 2019 to 20% in 2050. In the glass industry, natural gas continues to have the largest share, retaining more than an 88% share through the projection period.
• The bulk chemicals industry consumes natural gas and HGLs for both heat and power and feedstock. The relatively low projected prices for both fuels result in continued high shares of total energy consumption and reduced shares of purchased electricity as CHP adoption grows.
• In the United States, in addition to the food industry and, to some extent, refining (where bio-based feedstocks are used to produce blendstocks for the transportation fuels sector), one of the highest shares of renewables consumption is in the paper industry, where black liquor (a byproduct of the pulping process) serves as a major fuel for boilers and on-site CHP. The renewables share of total energy consumed in the paper industry increases from 61% in 2019 to 68% in 2050.
• Petroleum remains the primary fuel for refining and for agriculture, where distillate fuels most of the on-field equipment.
Across end-use sectors, carbon intensity declines with changes in the fuel mix, despite overall increases in energy consumption.
• Carbon intensity can vary greatly depending on the mix of fuels the end-use sectors consume. Historically, the industrial sector has had the lowest carbon intensity, as measured by CO2 emissions per British thermal unit. The transportation sector historically has had the highest carbon intensity, which continues in the projection because carbon-intensive petroleum remains the dominant fuel used in vehicles throughout the projection period.
• The generation fuel mix in the electric power sector has changed since the mid-2000s; less generation is coming from high carbon-intensive coal, and more generation is coming from natural gas and carbon-free renewables, such as wind and solar. Because of this change, the overall carbon intensity of the electric power sector declined by 30% from the mid-2000s to 2019 and is expected to continue to decline through 2050.
• If the CO2 emissions from the electricity sector in the end-use sectors that consume electricity are accounted for, carbon intensity declines to a greater degree across those sectors for all AEO2020 cases. In the Reference case, the carbon intensities of the residential and commercial sectors show no decline when their direct carbon intensities are counted from 2019 to 2050. When the electric power sector energy is distributed to the end-use sectors, the residential and commercial sectors decline by 17% and 18%, respectively, during the projection period, and the industrial sector declines by 11%. Transportation carbon intensity declines by 4%.
