

Will El Niño mean a warmer or colder 2026-2027, and will there be stock to meet demand?
I’ve received several inquiries from clients on the climate phenomenon El Niño that we’ve all been hearing about in the news – and for good reason. The above normal sea-surface temperatures that occur in the Eastern Pacific can have far reaching impacts on our weather as well as the markets. As of early September, the Climate Prediction Center currently forecasts a >90% chance of a very strong El Niño event this winter.
The heating oil market has already experienced impacts from El Niño. Refining activity in the Gulf during the summer has been running near capacity with minimal disruption. What’s the weather connection? As of this writing, we’ve had
a very quiet Atlantic hurricane season, preventing PADD 3 shut-downs due to storms. This can be partially explained by the increased vertical wind shear across the Atlantic, typical during El Niño years, which makes it tougher for thunderstorms to organize. Tropical Depression Dolly from August is a great example. It formed in the central Atlantic but ran into unfavorable vertical wind shear and dissipated before reaching the Lesser Antilles, as noted in the National Hurricane Center’s advisory archive.
El Niño and Northeast Winter Temperatures
However, the main El Niño question I keep getting from clients isn’t about hurricanes: “Matt, does an El Niño mean we will have a warmer winter in the Northeast?” One way to leverage the assumption of a strong El Niño year is through analog forecasting. The simple method looks at winters with similar conditions (think El Niño or La Niña) and uses the weather conditions from those years as forecasts. Similar strong El Niño years include 1982-83, 1991-92, 1997-98, 2015-2016, and 2023-24. I examined heating degree day (HDD) data for the December-February (DJF) period of those analogs. I then compared the individual years’ National Oceanic and Atmospheric Administration’s (NOAA) climate normals, which average the 1981-2010 timeframe. In the graph above, the y-axis shows the percent HDD departure from normal (%), with negative HDD departures meaning warmer-than-normal DJF periods. Stealing a strategy from my TV meteorologist friends, I also “localized it” to give you an idea of what happened in your neck of the woods by separating departures by state. The picture it paints is not a pretty one…
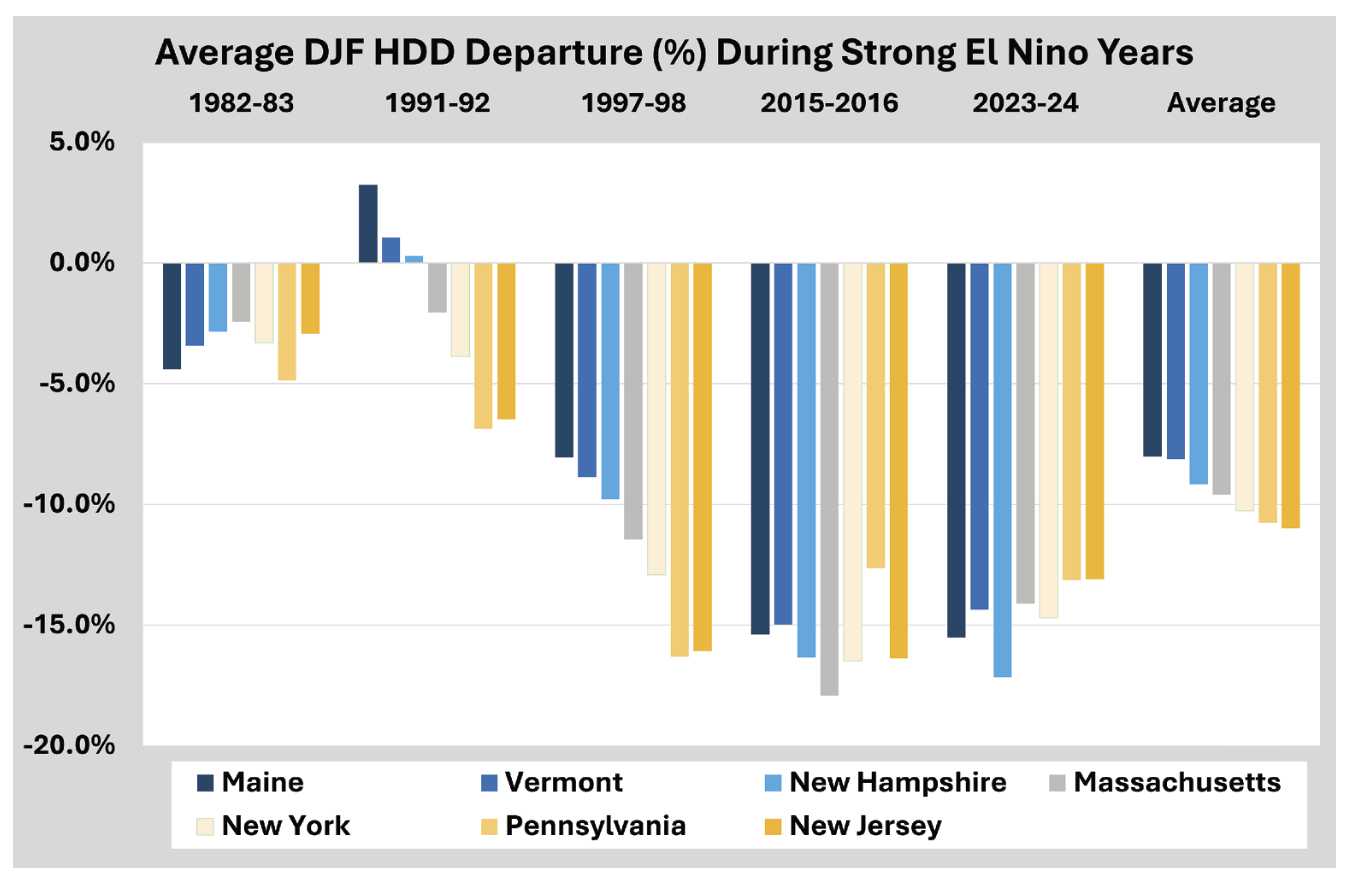
In all but one of our analogs, every single state ended with below normal HDDs. The average forecast using this method would tend to favor a warmer-than-normal winter. However, there are several nuances that can be seen upon further examination of the data. The magnitude across years, as well as the uniformity across states, does vary. In the 1982-83 and 1991-92 years, HDDs were closer to normal than the others. Additionally, in 1991-92 and 1997-98, there is a strong North-South gradient in the percentage departure from normal HDDs. In other words, Maine and Vermont had closer-to-normal winters compared to Pennsylvania and New Jersey.
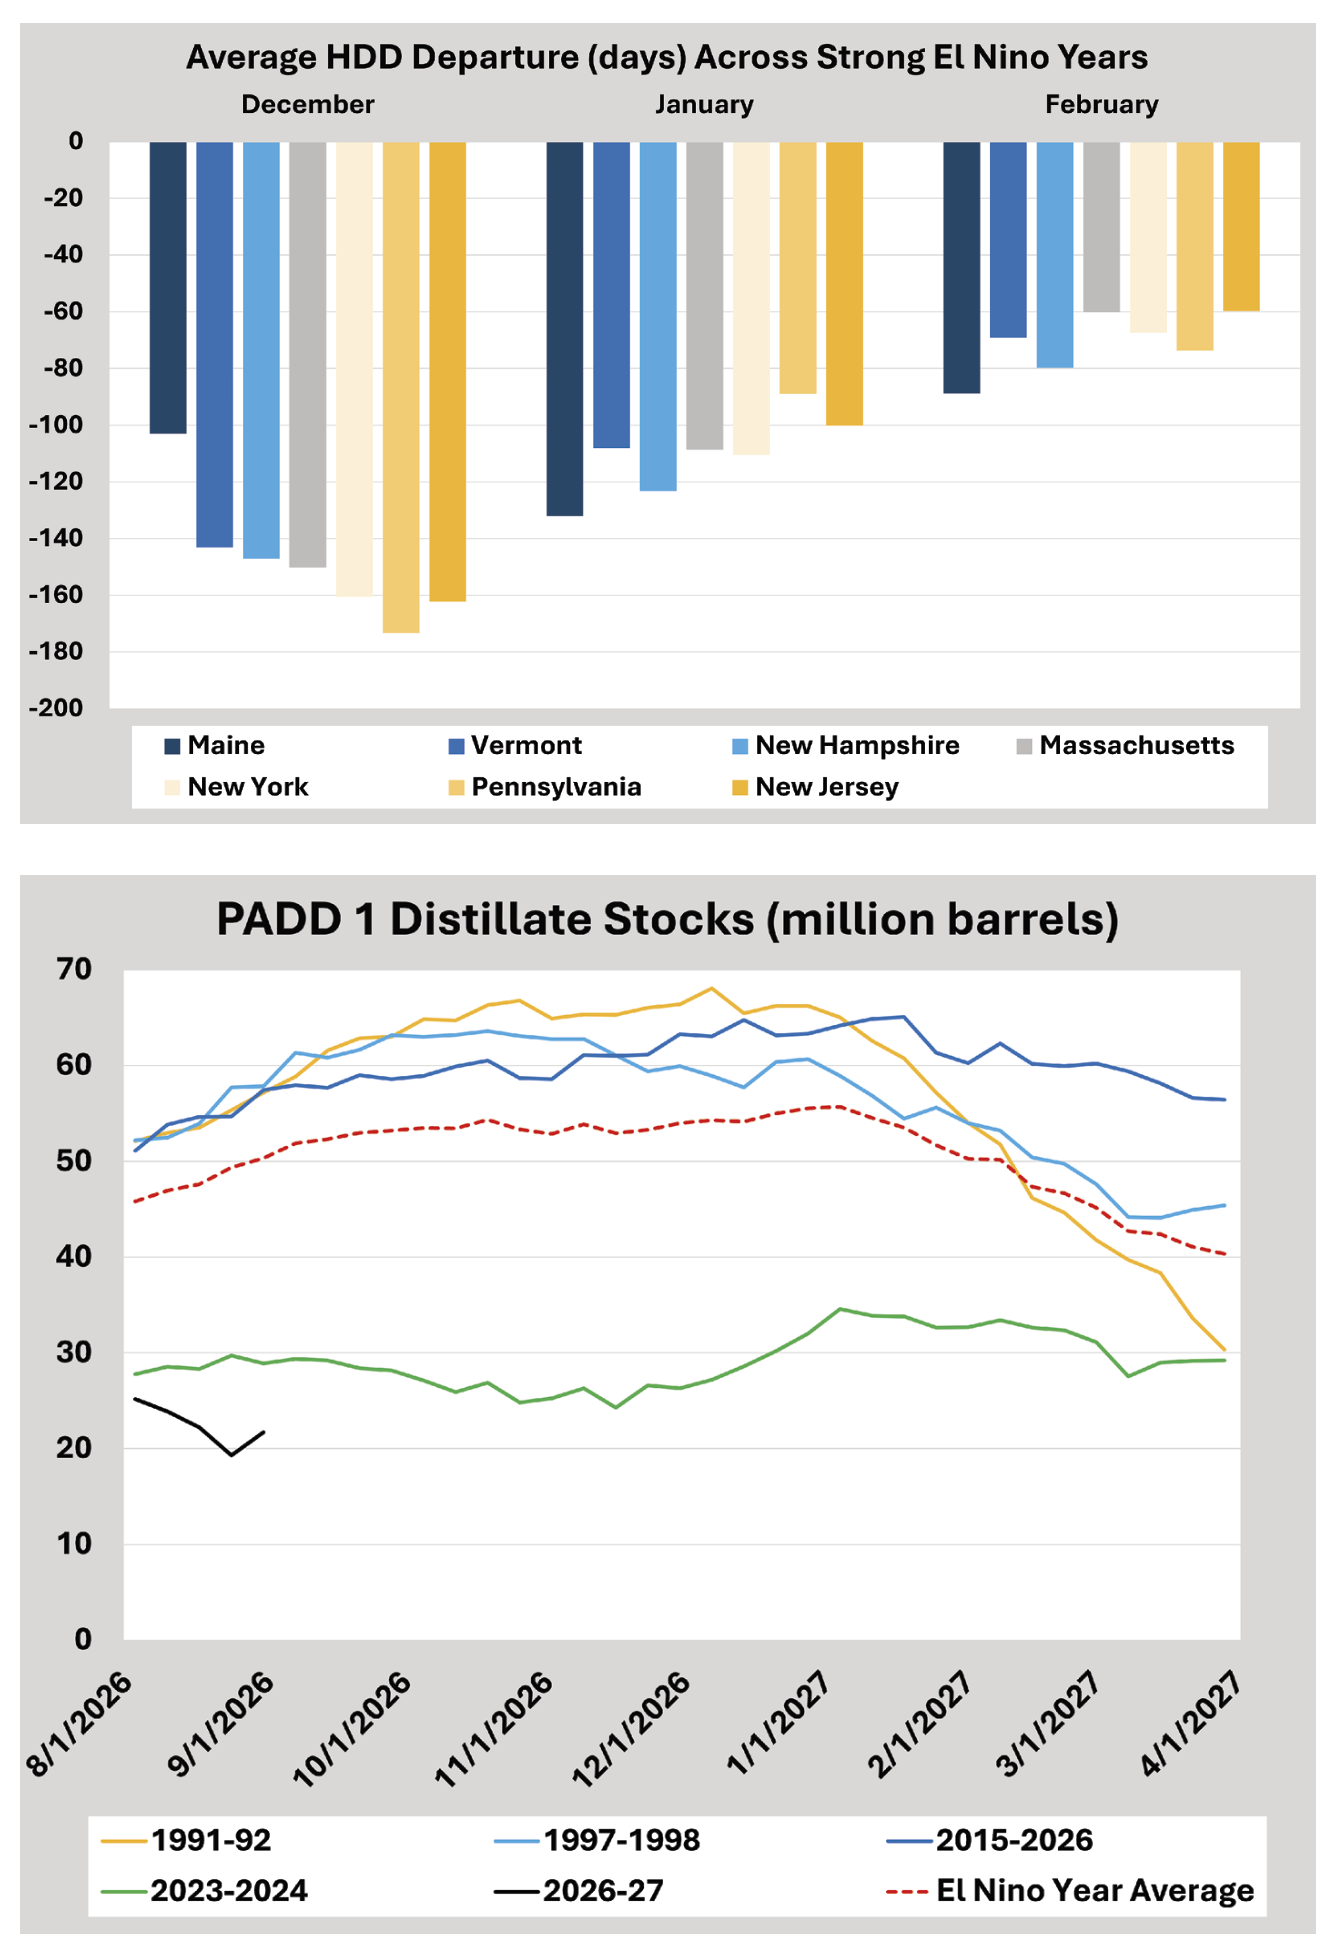
Another way we can analyze the data is to drill down by individual month across all years. The average departure of HDDs during El Niño years from normal is shown for December, January, and February by state. For this graph, the departures are in HDDs, rather than a percentage departure. Despite HDDs regularly peaking in January, the average departure of El Niño years occurred in December in all states but Maine. Why do these differences exist? Could it be snow cover variability or Atlantic sea surface temperature anomalies? This is not the article to dive deep into each individual year or month and postulate on the possible reasons. However, the analog method produces a general forecast of a warmer winter, with better chances of above normal temperatures in December as well as in the New Jersey/Pennsylvania area compared to other months/states. And now, in a rare twist of fate, I’m a meteorologist hoping his forecast is wrong!
2026 PADD 1 Inventory Levels Are Below All Analogs
It is important to overlay this forecast on the backdrop of lower distillate stocks in the US. This is where we can take the analog forecasting method a step further, and examine how distillate stocks varied in the same years. I plotted the 2026 storage alongside those from four of our El Niño analogs from August through March. Note: Weekly PADD 1 distillate storage data is not available for 1982-1983. In the warmer-than-normal winters, the average change in stocks was minimal, while in the near-normal winter of 1991-92, stocks dropped over 20 million barrels during that period. This would be a concerning forecast in 2026, with PADD 1 stocks currently sitting near 20 million barrels.
The weekly changes in weather forecasts and supply availability will need to be closely monitored by heating oil dealers, given the elevated risks this year. Leveraging daily market intelligence reports from trusted analysts can provide business owners with opportunities to limit negative impacts of tighter supply and/or lower HDDs.
Matt Davey is an Account Executive for Hedge Solutions working with consulting clients on hedging forward sales programs and purchasing oil and propane. He can be reached at: mdavey@hedgesolutions.com.

