

This year, Northeast prices may be affected more than other regions by the continuing Strait of Hormuz disruption.
Although some of this discussion overlaps with last month’s article, it is worth revisiting as we approach the heating season and the supply picture evolves rapidly amid the continuing Strait of Hormuz disruption. Location always matters in distillate markets, but it is especially important this year. As usual, basis will play a significant role in determining prices at rack markets across PADD 1.
The U.S.-Iran conflict has introduced a variety of anomalies into both crude oil and refined-product markets. For example, as of this writing in mid-August 2026, the oil market was briefly defined by a sharp contradiction: one large U.S. crude inventory build of 17 million barrels had eased immediate concerns about supply. Yet usable inventories of crude oil – and especially middle distillates – remain depleted. Severe constraints on transit through the Strait of Hormuz have delayed the recovery of Middle East supply and exports. As a result, crude oil may appear temporarily well supplied in a particular location while diesel, heating oil, and jet fuel remain structurally tight.
Globally, the supply picture is more severe. The IEA estimates that oil stocks fell by 69 million barrels in July and declined by 410 million barrels from the start of the conflict through the end of the month. OPEC estimates OECD commercial inventories at 2.729 billion barrels in June – 66.5 million barrels below the latest five-year average and 218.5 million barrels below the 2015-2019 average.
Global Distillate Inventories
Global middle-distillate inventories remain the weakest link in the petroleum complex. The IEA estimates that global refinery runs rose to 80.9 million barrels per day in July but remained nearly 5 million barrels per day below the year-earlier level. It again reduced its third-quarter estimate and now forecasts global refinery throughput to decline by 2.5 million barrels per day in 2026. Middle-distillate cracks and Atlantic Basin refining margins reached record highs as Gulf product exports and Russian refining remained disrupted.
The IEA estimates that diesel exports from Russia, the Middle East, and Asia were 1.3 million barrels per day below the year-earlier level – equivalent to roughly 20 percent of global seaborne diesel trade – while jet-fuel exports from those regions declined by approximately 670,000 barrels per day.
The result is a global market with limited redundancy. This allows for refining margins and diesel cracks to remain elevated even when crude prices decline because cheaper crude does not immediately translate into more refined product.
U.S. Distillate Market
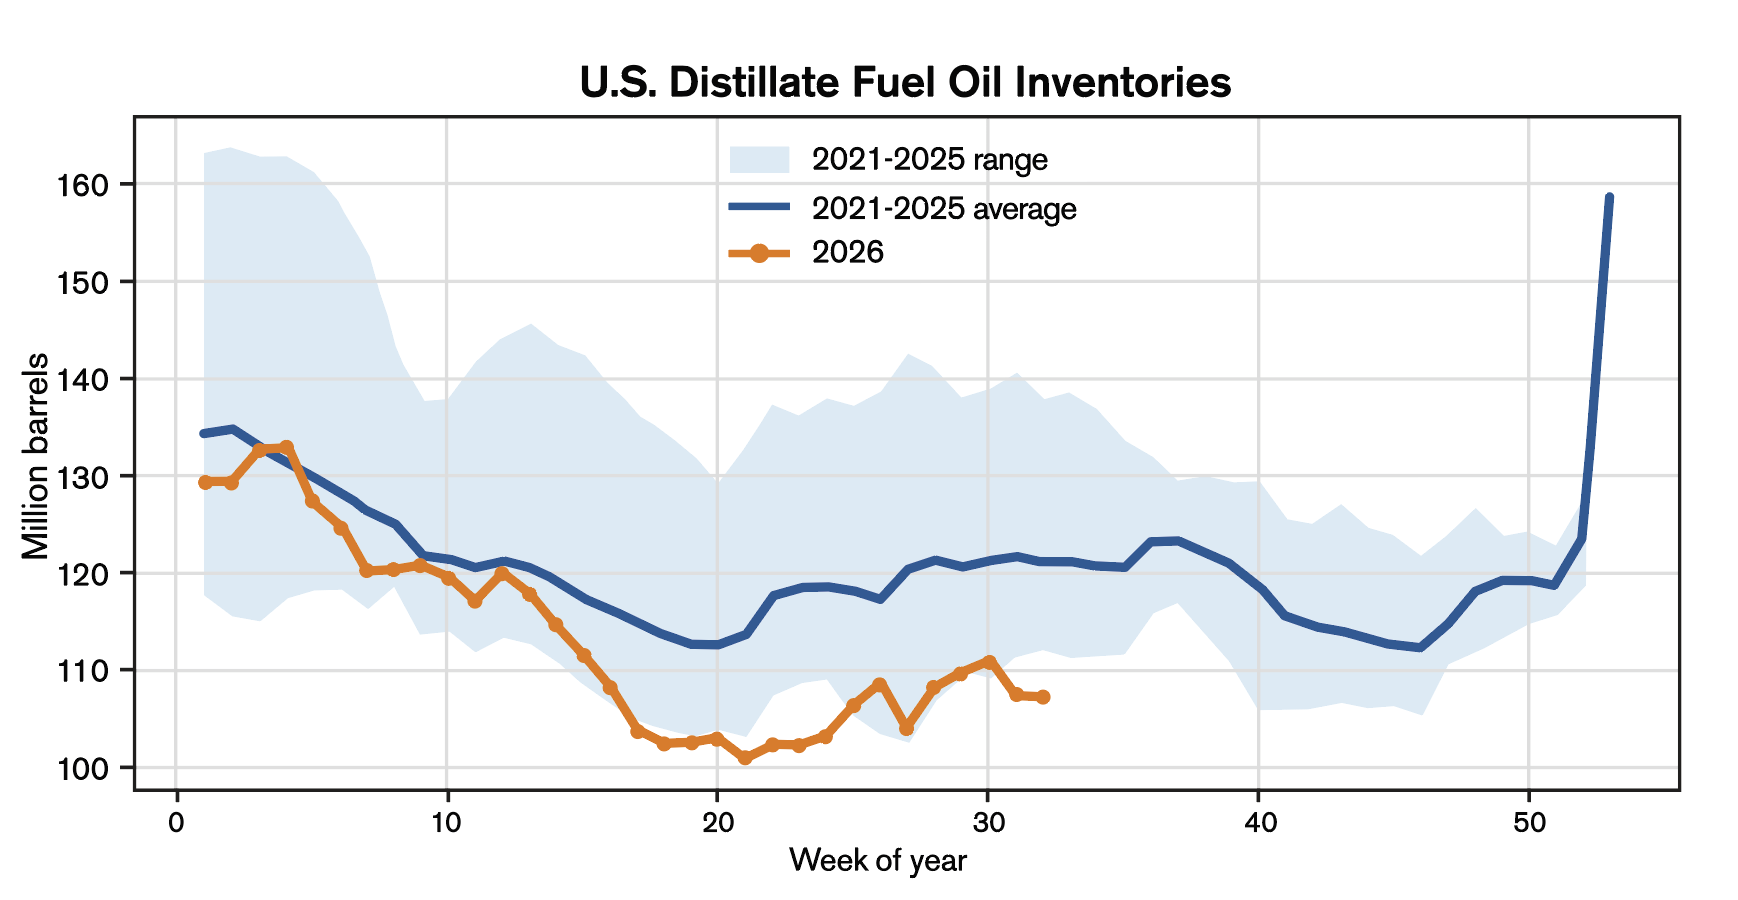
Total U.S. distillate inventories were 107.1 million barrels as of August 7, approximately 12 percent below the five-year seasonal average. Four-week average distillate product supplied was 3.7 million barrels per day, 1.9 percent above the comparable year-earlier period. The combination of low inventories and positive demand growth leaves the prompt market exposed.
Inventories remain low even with U.S. refineries operating at 96.2 percent utilization and distillate production near 5.3 million barrels per day – significantly above the 4.87-million-barrel-per-day comparison level. The system has little idle capacity available. Imports averaged only 111,000 barrels per day in the latest week. The 5-year average this time of year is closer to 150,000 barrels per day.
PADD 1 Distillate Inventories
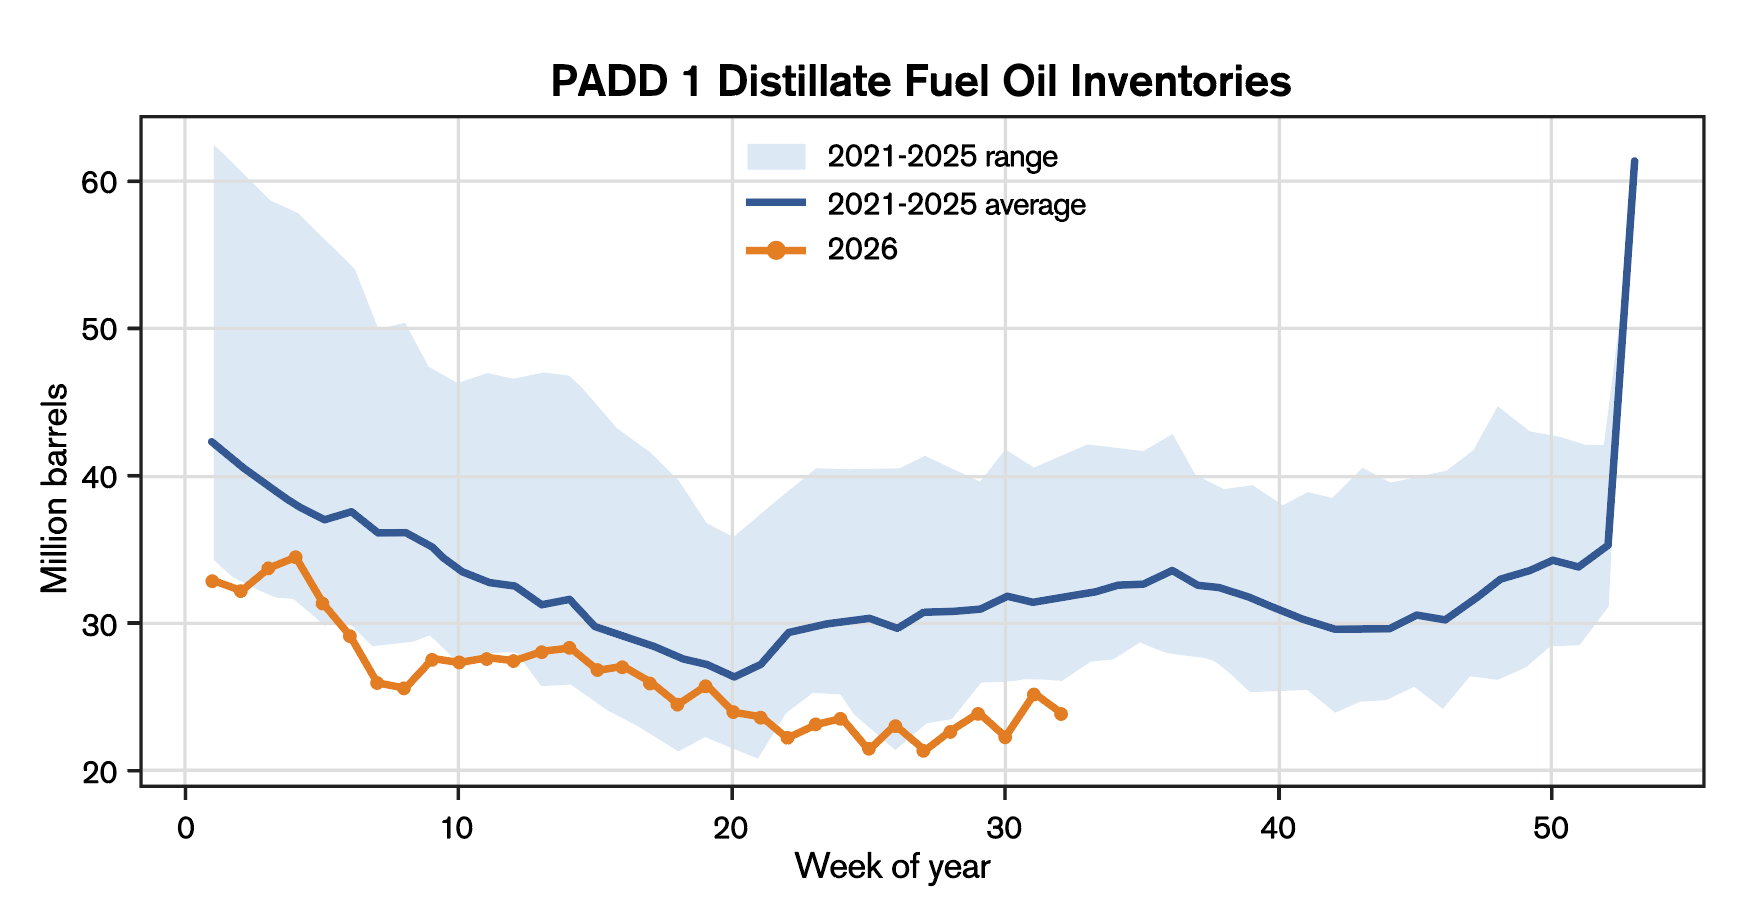
PADD 1 distillate inventories were 23.9 million barrels for the week ending August 7. New England held only 2.6 million barrels, the Central Atlantic held 12.6 million, and the Lower Atlantic held 8.6 million. The East Coast remains structurally short of refining capacity and depends on Gulf Coast pipeline movements and Atlantic Basin imports.
We are fielding many questions about the condition of the local distillate market – specifically PADD 1, or the East Coast from Maine to Maryland. Suppliers are warning of tight supply across rack markets. Those warnings are justified by both market fundamentals and the forward curve.
Yet when marketers see rack prices at a significant discount to the spot NYMEX contract, they naturally conclude that supply is plentiful. Adding to that perception, New York Harbor ULSHO is trading at a striking $0.2600-per-gallon discount to the spot NYMEX contract.
The extreme discount of physical New York Harbor distillates to the nearby ULSD futures contract should not be interpreted as evidence that the broader diesel market is oversupplied. It is an anomaly reflecting a temporary mismatch among the delivery specifications and timing of the expiring futures contracts, logistics, and the prompt availability of physical barrels. Futures can carry a scarcity premium associated with deliverable supply and short covering. Basis at various rack locations can reverse rapidly as the contract rolls or physical arbitrage opportunities emerge.
The steep backwardation in ULSD futures is fundamentally a signal of low supply cover. Currently, prompt product is worth more than deferred product because inventories are low, replacement risk is high, refinery capacity is stretched, and exporters are competing for U.S. barrels.
This structure also penalizes storage: buying prompt gallons and selling deferred futures can lock in negative economics. The curve therefore discourages the inventory building that would normally relieve tightness, leaving the market dependent on continuous refinery operations and reliable imports – neither of which can be taken for granted.
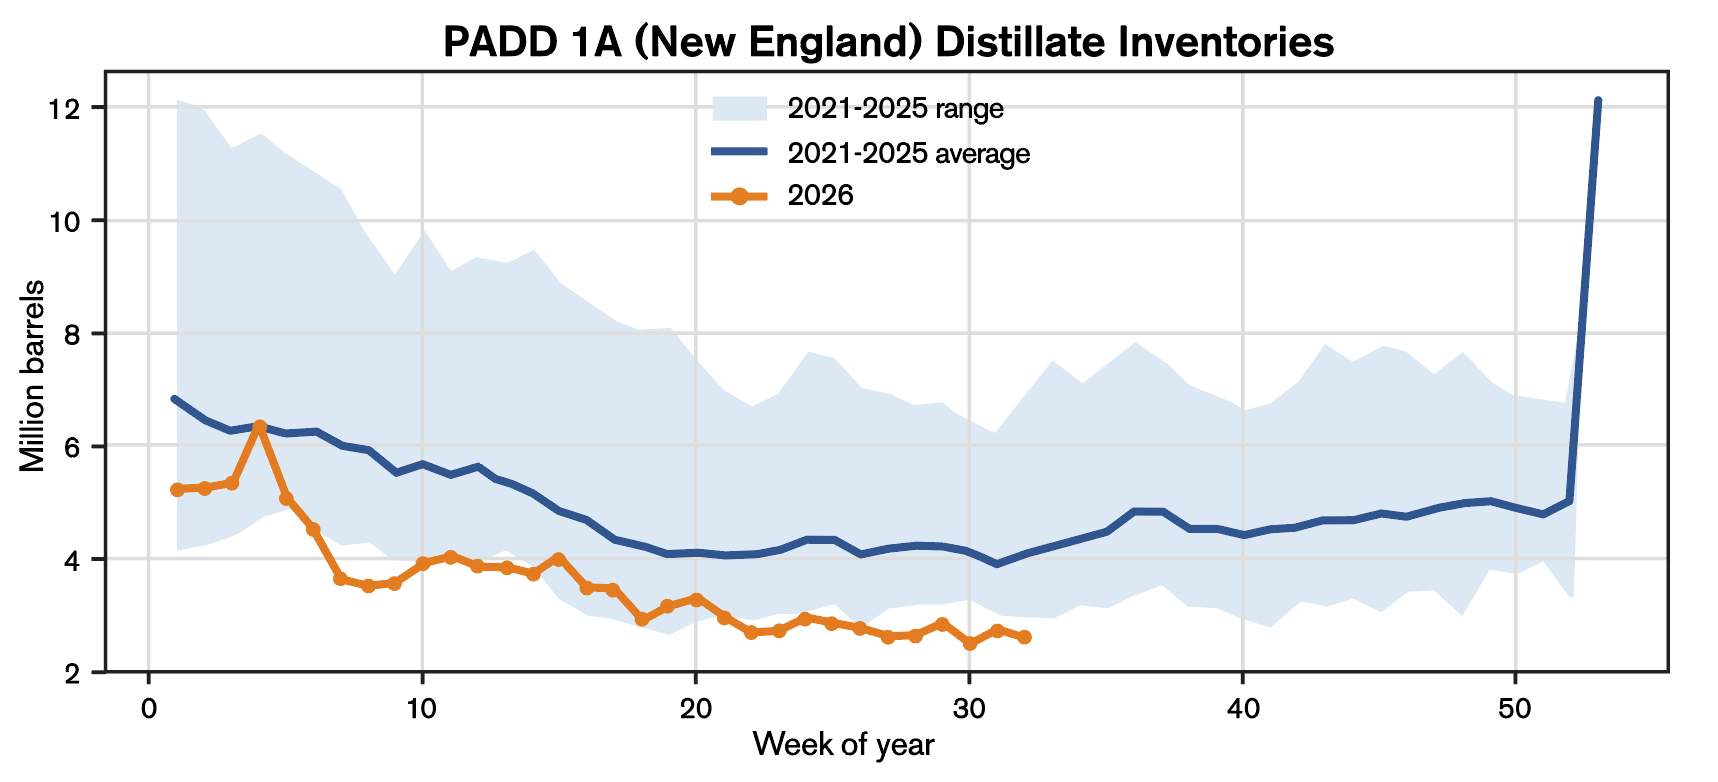
PADD 1A – the New England states – should be an area of concern. It currently holds an estimated 2.6 million barrels of inventory. Except for Connecticut, waterborne cargoes are the region’s primary source of supply. Connecticut also has access to New York Harbor through smaller barges and cargoes, providing somewhat greater flexibility. Nevertheless, the current state of New England inventories, combined with the region’s limited supply options, makes it especially vulnerable to basis volatility.
New England is particularly sensitive because pipeline connectivity is limited and winter heating demand is concentrated. Inventories can appear adequate during the summer yet provide insufficient protection against a cold start to winter, delayed imports, or a refinery outage.
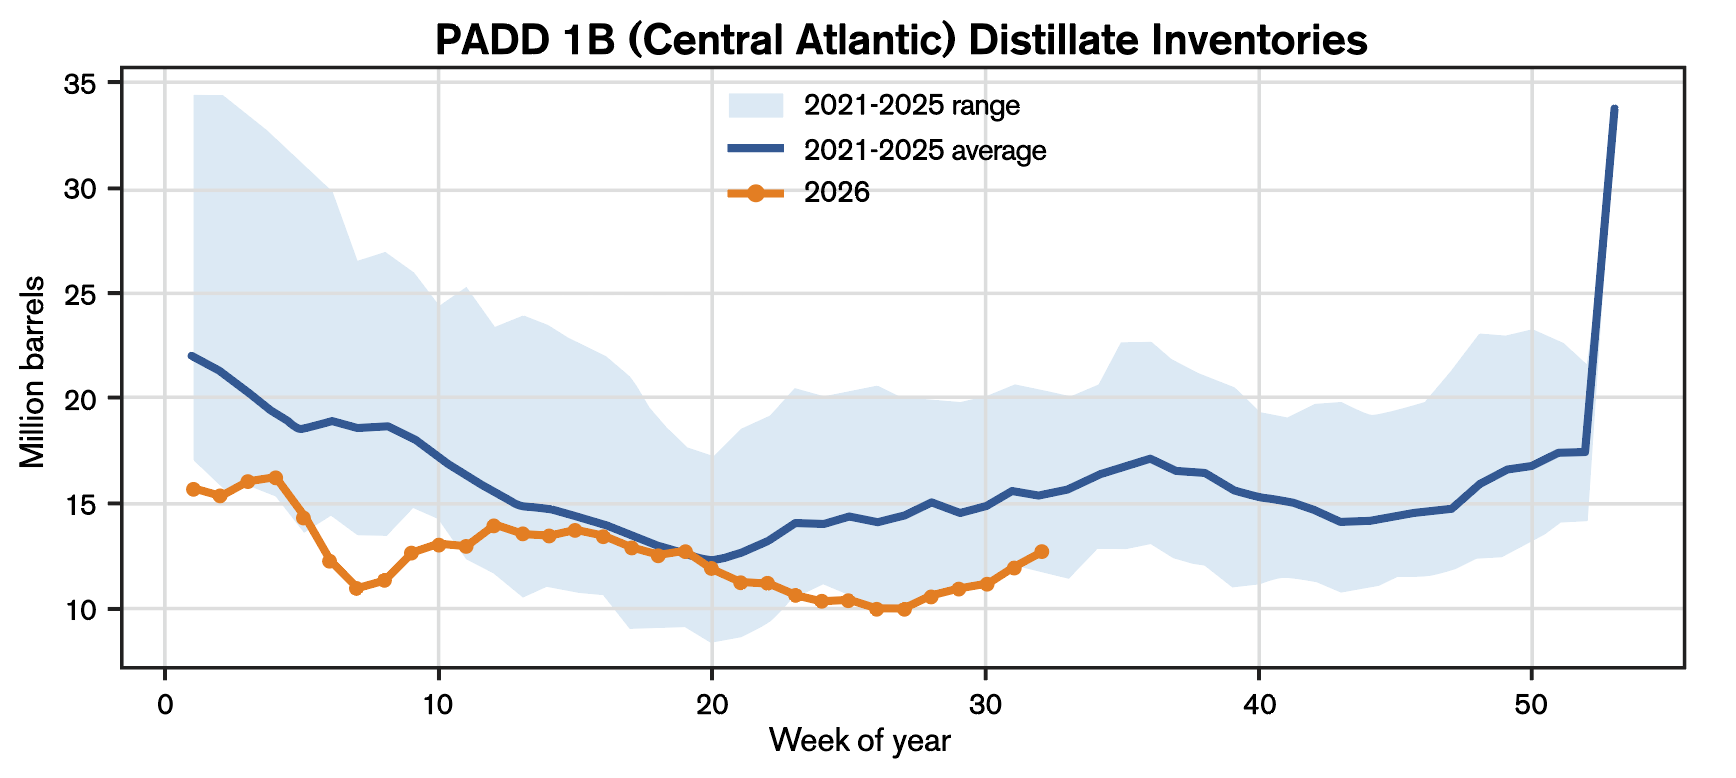
PADD 1B, the Mid-Atlantic region, is also in an anemic position. However, it has significantly more supply flexibility through the Colonial Pipeline, waterborne supply, New York Harbor, and limited regional refinery production.
Here We Go Again
I understand the fatigue associated with repeatedly hearing the term “backwardation.” Nevertheless, it bears revisiting because the market has remained in this condition for what feels like an eternity. When prompt futures trade above deferred futures, the value of owning usable diesel today exceeds the financial return from storing it for later.
Again, low inventory is the driving force here. The second driver is limited refinery flexibility: U.S. plants are operating near maximum capacity, while global refinery runs remain well below 2025 levels. The third is export competition, as record Atlantic Basin margins attract U.S. barrels to foreign buyers.
So why can’t the market work its way out of this negative and return to a healthier contango structure? The answer is that the backwardated market is self-reinforcing. A supplier or merchant considering storage must buy expensive prompt product, incur financing and operating costs, and sell cheaper deferred futures. Unless basis appreciation or an unusually strong physical premium offsets that negative carry, the rational choice is to minimize inventory. The curve effectively tells commercial participants not to store product, reducing buffer stocks and keeping prompt supply tight.
Compounding this dilemma, the negative curve also reflects event risk. Prompt contracts carry the immediate risk of renewed Hormuz disruption, further Russian export losses, hurricane-related outages, and unplanned refinery downtime. Meanwhile, the forward futures contracts assume some degree of normalization and eventual rebuilding of production. This difference in the concentration of risk creates a steep downward slope even if the market remains fundamentally tight several months forward.
Conclusions
- The U.S.-Iran conflict is the primary driver of escalating prices and a major cause of the extreme backwardation in the market.
- Restoring 10–20 million barrels of U.S. distillate inventories while continuing to meet domestic demand and export commitments will require sustained positive weekly builds, unlikely if current conditions persist.
- Rebuilding global inventories will be even more difficult because Europe, Latin America, and Asia are attempting to do the same. Even a breakthrough in the conflict would not immediately normalize the market. It will take months to restore inventories, refining operations, and logistics to more normal conditions.
- U.S. distillate production and refinery operating capacity are effectively maxed out. Any disruption to the supply chain – including severe weather or refinery outages – could trigger further price spikes.
- PADD 1 distillate supply is distressed and is unlikely to recover fully before the added pressure of winter demand arrives.
- New England is the most vulnerable region because it relies heavily on waterborne cargoes and imports that must compete with European and Asian demand.
Rich Larkin is President of risk management consultancy Hedge Solutions. He can be reached at rlarkin@hedgesolutions.com or 800-709-2949.
The information provided in this market update is general market commentary provided solely for educational and informational purposes. The information was obtained from sources believed to be reliable, but we do not guarantee its accuracy. No statement within the update should be construed as a recommendation, solicitation or offer to buy or sell any futures or options on futures or to otherwise provide investment advice. Any use of the information provided in this update is at your own risk.
Sources and Notes
U.S. Energy Information Administration, Weekly Petroleum Status Report, week ending August 7, 2026, released August 12, 2026.
U.S. Energy Information Administration, Short-Term Energy Outlook, August 2026, released August 11, 2026.
International Energy Agency, Oil Market Report, August 2026 public highlights.
Organization of the Petroleum Exporting Countries, Monthly Oil Market Report, August 2026, OECD commercial stock estimates.
CME Group, NY Harbor ULSD futures quotes and contract specifications, accessed August 13, 2026.
AI Disclosure: Artificial intelligence assisted with research, data organization. Material facts were reviewed against cited primary sources;
AI-generated content should not be considered an independent source or trading advice.

