
Heightened price awareness provides an opportunity for dealers to present a price cap solution
The heating season of 2025-26 was a notable one: the coldest winter in over 10 years for some locations of the East Coast and a late-season price spike due to conflict in the Middle East.
Price movements were certainly different from years past. From mid-2023 to December 2025, heating oil prices were steady to lower, with minimal volatility. This lulled consumers (and maybe some dealers) into a routine of stable prices. With this consistency, paying upfront fees to protect against sudden pops may have seemed ill-advised. However, now that geopolitical volatility has entered back into the equation, the demand to limit energy costs has jumped to the top of consumer minds. In this environment, dealers can meet their customers’ need for price protection and manage their own risk by utilizing hedging tools specific to the heating oil industry.
Supply Shock Moves Retail Prices
Crude oil and refined products prices reacted sharply to the closure of the Strait of Hormuz due to the US-Iran conflict. When the crisis began, retailers had no choice but to raise their retail price to the $4-$5 range, and quickly. At Hedge Solutions, we monitor more than 100 companies who post their daily price on their websites. Normally, as I talked about in my last article (“Don’t Try To Time The Market, Time Your Margin!” Jan-Feb 2026), there is a lag in the increase of retail prices, leading to lower margins. However, this event has been a bit different. With rack costs shifting 40 cents in a day, no dealer could stick with yesterday’s posted price in order to steal a customer or two from a competitor.
In the first graph, I’ve charted both the average retail price, as well as the percentage of companies in the index that changed their price from the day prior. This data can be narrowed down to companies to within X miles of a specific city, but I’ll save that for another article… We reached a peak early March as nearly 90% of companies moved their daily price during the opening salvos of the US-Iran war. Other notable periods of widespread spikes this season include the November strikes on energy infrastructure in the Russia-Ukraine war and the late January cold spell/supply tightness. In the remaining parts of the winter, only a small amount (~20% of index companies) changed what they charged daily. The magnitude, ubiquity, and the relentlessness of the price moves in March were certainly different than other intervals this season.
Cap Price Customers vs Those Without Price Protection
Customers without price protection were likely shocked and frustrated at the cost to fill their tanks in March. From what I hear from our clients, customers did not direct anger toward dealers themselves for higher prices, understanding that geopolitics are out of their control. But this heightened price awareness provides an opportunity for dealers to present a solution to consumers for next season. I’m sure they would be interested to know that cap gallon clients did not experience these rate increases. For anyone unfamiliar with these plans, they offer the customer the option to enroll in capped price programs for an upfront fee. When deliveries occur, the price per gallon will be either the lower of the retail price or the cap price. This means that the customer can benefit both ways – getting to ride prices down during a sell-off, while bypassing any jump in rates.
Dealers that ramp up the marketing of their cap program in the wake of the 2025-26 may strengthen their relationships with customers and maybe even increase market share for several reasons. First, the March rally has reminded the public that price spikes (and price reversals for that matter) can come out of nowhere. Case-in-point, the February Short-Term Energy Outlook from the EIA actually forecasted lower oil prices over 2026, not higher. Second, the two-sided benefit story is clearly visible this past season. See the Cap Price Example chart. The price that a $3.30 cap customer paid vs what a customer without price protection paid is shown from October-March. It highlights the value of the cap program as prices both move up and down.
Another reason it is important to consider talking to your customers about price protection is that your rival down the street is likely doing so. If a customer of a rival is unhappy with their service but requires the peace of mind that a cap program provides, you will need one to gain the business. Finally, as things stand in late March, the prices at which dealers can hedge next season’s gallons are lower than those for the next month. Offering a cap price lower than your current posted price may entice more customers to sign up.
OTC Derivatives for Cap Programs
In order for dealers to offer these programs, they must be able to offset their risk. One way to accomplish this is to use hedging tools like over-the-counter (OTC) derivatives. For example, let’s say a dealer purchased an OTC call for 25 cents/gallon premium with a $2.20 strike for the month of March. The dealer would then add their local rack basis and margin (we will keep it simple with $0.00 average basis and $1.00 margin) and offer their clients a $3.20 cap price. They would charge the customer the 25 cent fee to participate, which covers the cost for the option. The OTC call would pay out the difference between the settlement price and the strike (or zero if prices fall), to compensate for a rise in rack price prices if it occurs.
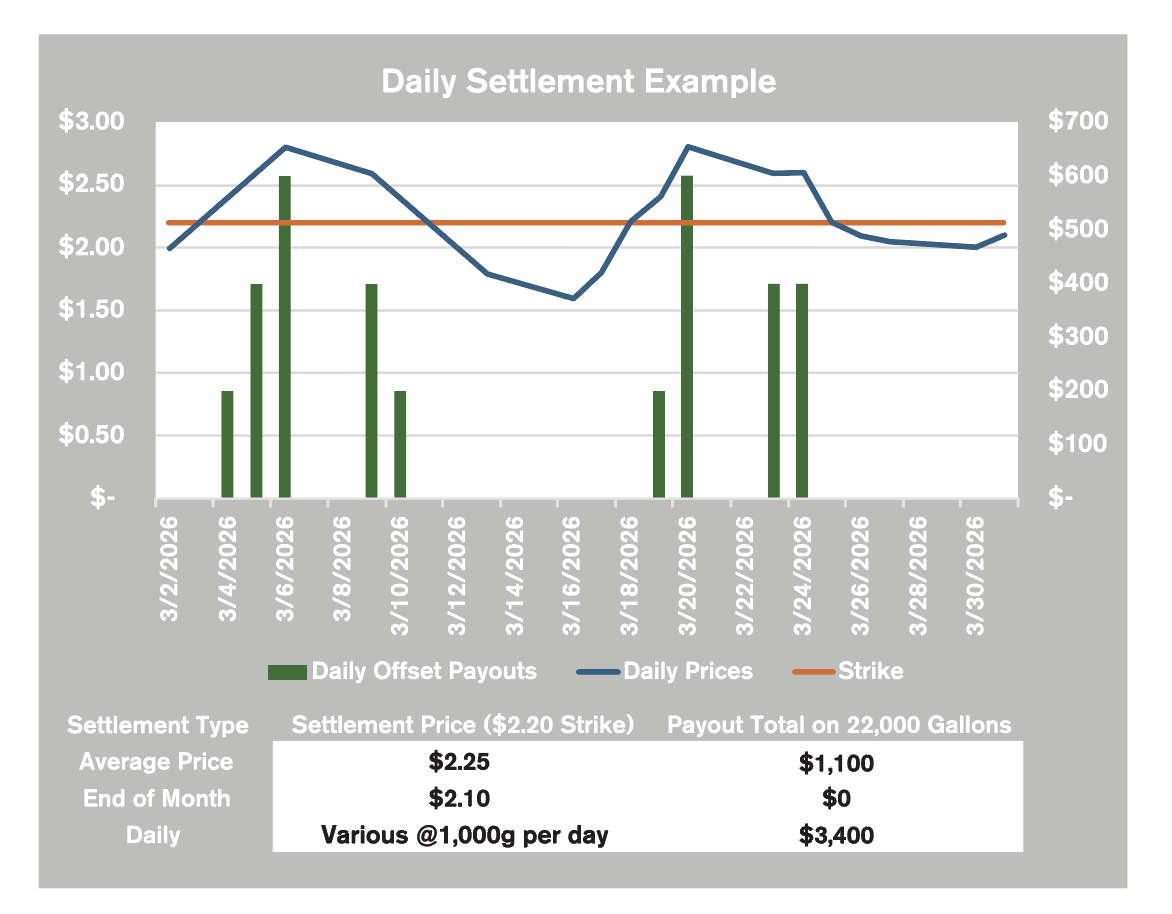
Two key features of these OTC derivatives that have been helpful given the recent daily volatility of rack prices are daily settlements and custom volumes. Instead of standard 42,000 gallon sizes, OTC derivatives allow for much smaller increments. Additionally, daily settlements mean that an even portion of monthly gallons are settled each trading day, using each day’s settlement price. This compares to taking a monthly average of each day’s settlement price or using one day at the end of the month to settle all of the month’s gallons. During periods of higher volatility, daily settlement payouts can better align with temporary jumps in costs that dealer’s experience. An example in the chart and table show a call at a $2.20 strike for 22,000 gallons during a volatile month. The end of month settlement led to no payout at all, while the average price was $2.25 and paid out $1,100. The daily offset call evenly spread the 22,000 gallons to have 1,000 settle each of the 22 trading days, leading to a $3,400 payout. Of course, different examples will lead to different settlement-type payout rankings. The main point I’m trying to get across is that since dealers pick up from the rack every day, it is helpful to try to match their hedging vehicle to their exposure.
As always, if you have any questions about the recent volatility or would like support for cap price programs, don’t hesitate to reach out to your hedging consultants.
Matt Davey is an Account Executive for Hedge Solutions working with consulting clients on hedging forward sales programs and purchasing oil and propane. He can be reached at: mdavey@hedgesolutions.com.
