All
Breaking Down the Market Breakdown
by Rich Larkin, Hedge Solutions

The hows and whys of the price and supply issues facing the fuel industry
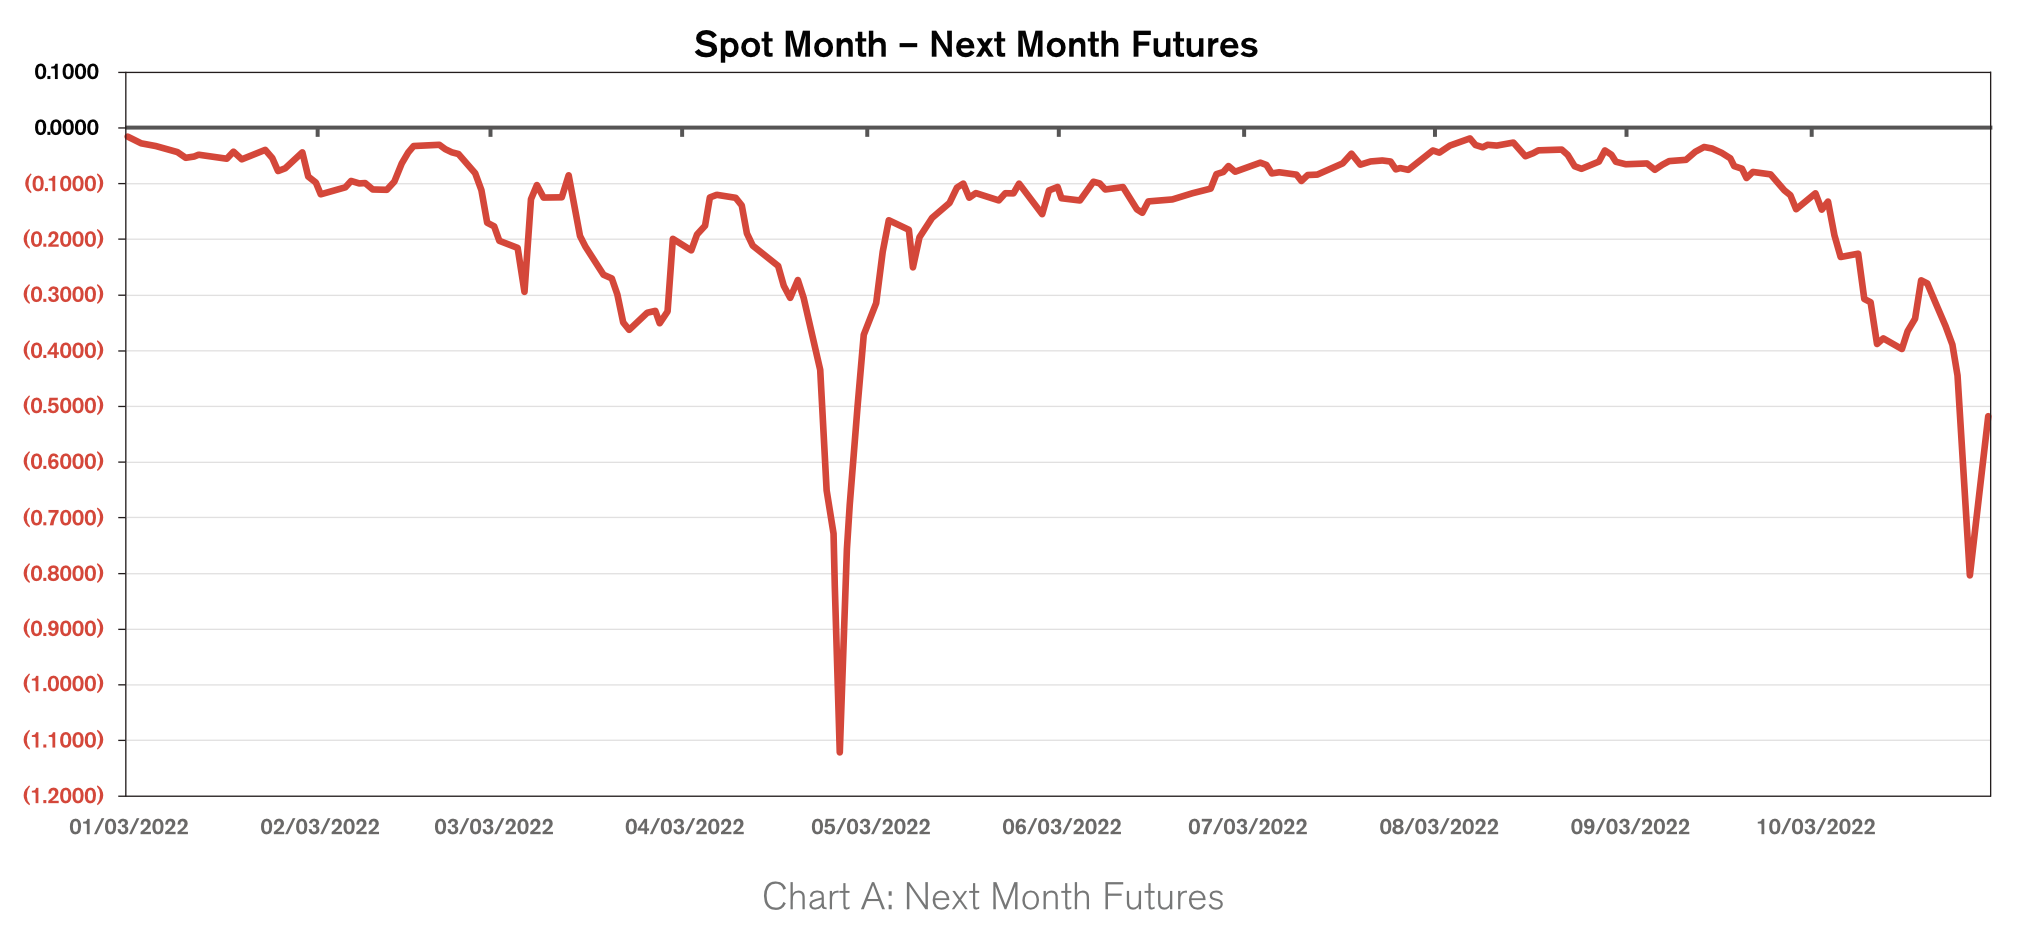
By now you’ve been exposed ad nauseum to the term “backwardation” and no doubt experienced the cause and effect that it has on your local rack price. ULSD futures (CME) that influence these prices have been trading in the inverse going back to January of this year (Chart a). The start of the Russia-Ukraine war heightened this condition further. The lack of a healthy supplier mix has amplified the so-called blow outs to historical levels and have persisted in unprecedented fashion. More on this later.
To understand how we got here I’ve broken down the root causes of the problem into their respective areas that are symptomatic to the development of this phenomena.
PADD 1 Inventories Decline to Anemic Levels
The region known as PADD 1 (geographic areas established in the US during World War II for gasoline rationing) covers all of the East Coast. PADD 1 is the only district that is broken into subsets, called PADD 1A, PADD 1B, and PADD 1C. I am going to focus on PADD 1A (New England) and 1B (Mid Atlantic) where most of the heating oil demand is. Currently PADD 1A stocks are off 57 percent from the 5-year average. PADD 1B is off 59% from its 5-year average.
Several factors likely contribute to these Northeast stocks running substantially below normal levels. The sudden recovery from the demand destruction due to COVID is one. Additionally, we have lost a significant amount of distillate production on the East Coast. The closure in 2019 of the PES plant in Philadelphia resulted in a loss of 335,000 bbls/day of refined products. The PBF refinery, which produces mostly distillates and is in New Jersey, has been running at well below its 100,000 bbl/day capacity until recently. And nationally, a total of five refineries have shut down in the past two years, a total loss of over a million barrels per day of refined products’ output.
The US exports distillates at a rate of 8 to 1. We export more product than we import. The majority of East Coast imports came from Russia prior to this year. Typical distillate imports totals range between 90k and 300k bbls/day. We are currently 20% behind the 5-year average. More importantly, Russian imports were an essential supplement to East Coast distillate supplies in the colder months of January and February.
Backwardation in The Futures Market
Backwardation, when each consecutive month in the futures’ market is cheaper than the preceding month, is normally the result of low inventories. The physical commodities’ markets are remarkably efficient at illustrating the condition, or health, of their respective commodity. In this case, the proxy for distillates, ULSD futures, are signaling a very unhealthy condition on the East Coast. It also makes it difficult for suppliers to carry inventory since the forward futures contracts do not offer a positive, or profitable hedge on their inventories.
In theory, backwardation, where the highest end of the forward curve is the prompt month, should appeal to the producers of the product to send their supplies to the highest price point. The East Coast has likely obtained the mantel of highest price on the planet, which should attract supplies into the region. If so, we should see evidence of this on two fronts. The inverse in the futures contracts, or the spreads between the forward months, should contract. Also, the cash market basis for the region, in this case New York Harbor, should drop. In other words, the spot futures contract and the cash price should converge. However, this cannot and will not happen until either supplies increase dramatically or demand decreases, thereby naturally increasing inventory accumulation.
Local Rack Suppliers Are Having Difficulty Supplying Terminals
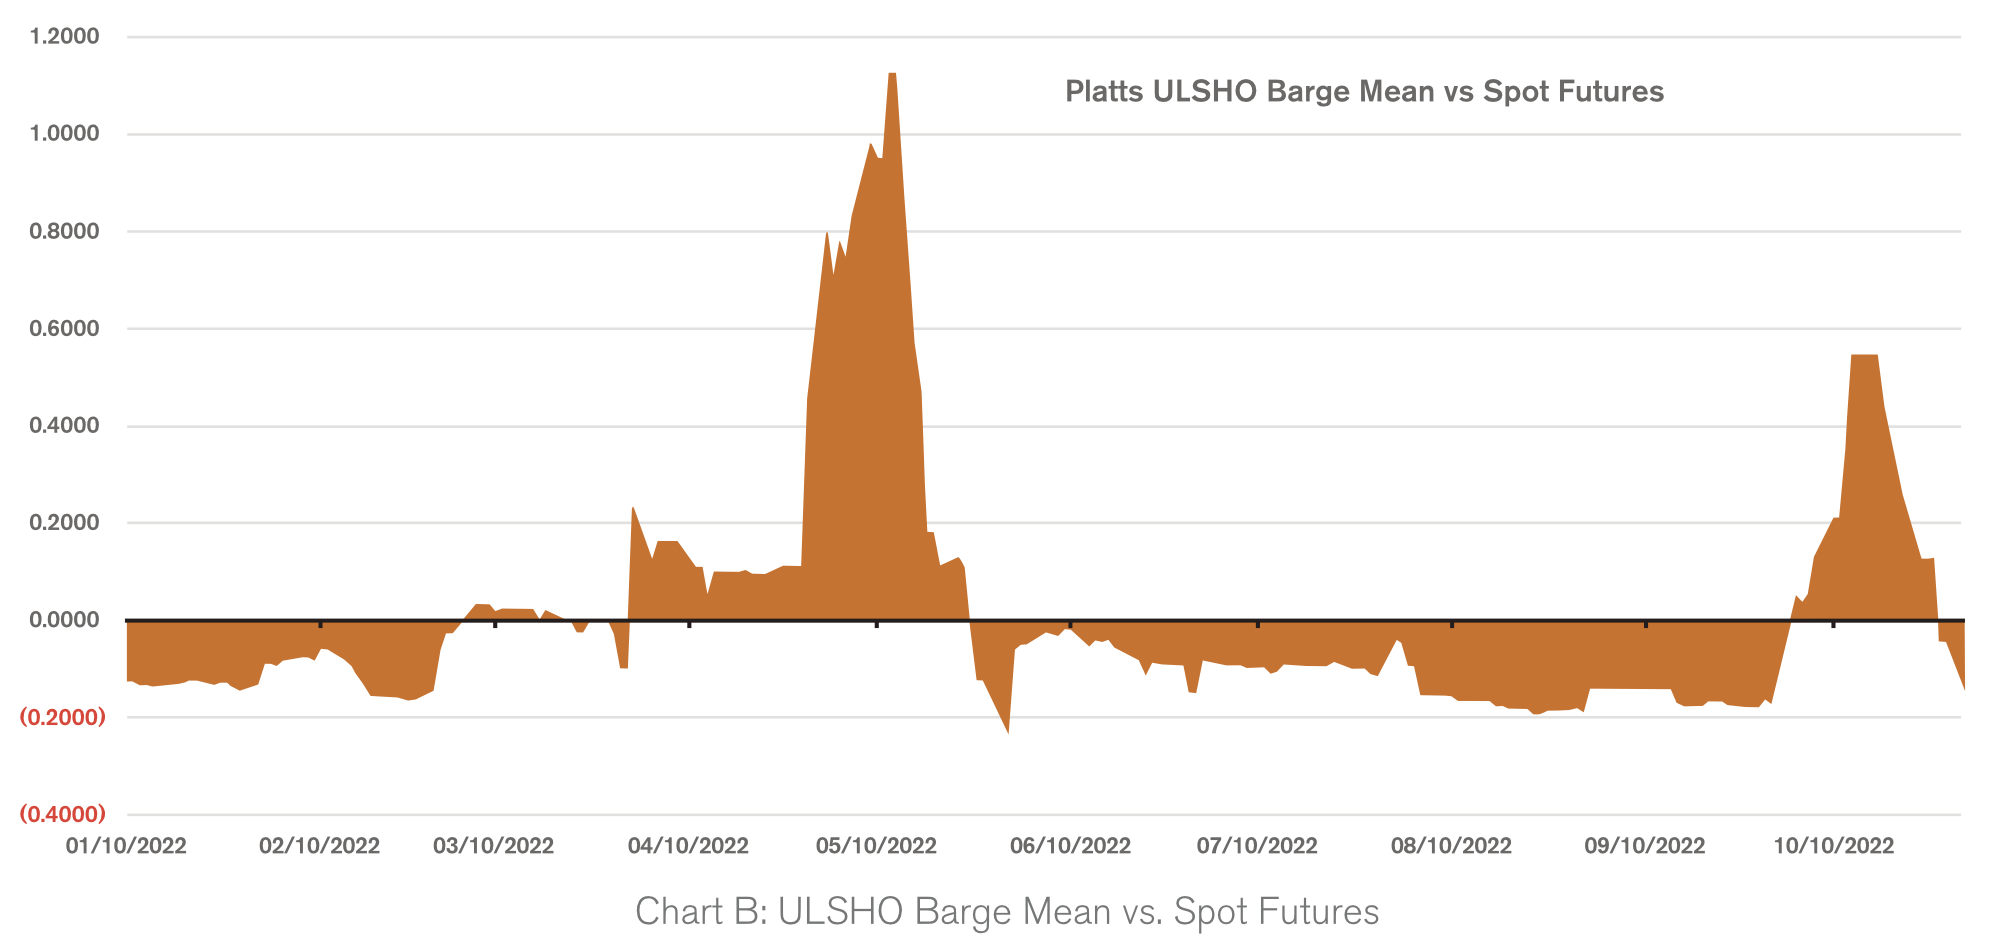
As if the futures’ market in backwardation doesn’t make supplying the local terminals difficult enough, suppliers are now dealing with a cash market price that has been continually higher than the spot month futures’ price (Chart B). This places a two-dimensional risk in front of them.
By example, the New York Harbor cash price as of this writing is at a 74 cents/gallon premium to the December spot contract. It is almost impossible for the supplier to hedge the risk if, shortly after dropping a barge or cargo into the terminal, the price drops precipitously; as it did briefly at the end of October by almost 50 cents per gallon. This would equate to a loss of a million dollars on just a small barge of 50,000 barrels. This ugly hedging equation is what has caused the East Coast wholesalers to adopt a just-in-time inventory policy to a level so low that they are running the terminals on fumes or simply running out.
One source of frustration is the enormous price difference in the other cash markets around the world, as well as just around the corner in the Gulf Coast refining hub. As of this writing, the cash price for distillates in the Gulf Coast region is at a discount to the spot NYMEX contract of 34 cents/gallon, a difference of $1.08/gallon before shipping costs. This product does make its way to the East Coast via the pipeline system, but there’s not enough capacity to provide relief.
Will There be a Jones Act Waiver?
The controversial federal maritime law, the Jones Act, is often blamed for the lack of shipping capacity to move the cheaper oil from the Gulf Coast to New York harbor via tankers. The Jones Act regulates maritime commerce in the United States. The Act requires goods shipped between U.S. ports to be transported on ships that are built, owned, and operated by United States citizens. There are roughly 56 tankers in the US that meet these requirements. It’s not enough. Hence, the shipping rates can often negate the price advantage.
Will the Biden administration recommend a waiver of the Jones Act? The last waiver, which must be authorized by Homeland Security, was in 2017 during the Trump administration to provide relief in getting supplies to Puerto Rico after Hurricane Maria. Waivers are temporary, usually days not weeks. Previous abdications have resulted in numerous complaints about the difficulty in finding ships to fill the void on short notice, thus blunting the impact needed to provide relief.
Winter is Coming!
How do we get out of this mess before winter arrives? The answer is it won’t be easy and we’re going to need a bit of luck. Relief can only come from an increase in supply or a decrease in demand. It is that elementary. Though global supplies are tight, bankers and traders are predicting that looming recessions around the globe will result in considerable demand destruction. The use of distillates come primarily from the transportation and manufacturing sectors that will likely see consumption deteriorate. At the same time, refiners around the globe are cranking thanks to crack spreads (a proxy for refiners’ profit margins) running more than double the norm at $60 per barrel.
High prices usually attract more supplies. Historically, when a large delta develops between cash markets, the oil would quickly gravitate to the higher price point and suppress differentials while also flattening the inverse in futures’ contracts, allowing for a better hedge for bringing in more product in the coming weeks. Unfortunately, I think this time around will prove more difficult to correct if we are counting on this phenomenon as the only remedy.
The Lack of Physical Liquidity in the East Coast Rack Markets is Problematic
The East Coast supplier mix is a big part of the dilemma. There aren’t enough of them. After reviewing supplier counts since 2000, one can understand why this issue is not likely to go away soon. Ten years ago, you could look up and down the Northeast corridor and find that most terminals had a minimum of eight suppliers selling refined products. Many had ten or more. Most of the suppliers would trade physical supply with each other between rack locations.
By example, if supplier A had product in a New Haven terminal and needed product in a Boston terminal, they would trade with supplier B who needed product in New Haven but had product in Boston. Physical trading would also take place in the same terminal location. This liquidity in the physical rack markets would help to mitigate supply tightness as “trading in place” would buy time while suppliers waited for the next barge or cargo to arrive. Today, most rack locations up and down the East Coast not only have fewer suppliers, but don’t enjoy the physical trading opportunities available 10 years ago for multiple reasons.
I’ve written articles about this numerous times over the past 15 years. In those articles I discuss the likelihood of energy marketers returning to the practice from years past of engaging in supply contracts. At Hedge we have advised our clients on how these contracts should be set up. Transparency is a critical component to supply agreements.
With the transition to biofuels on the horizon, I fear that the aforementioned factors contributing to supply tightness will persist as wholesalers are faced with steep learning curves and uncertainty over how much and when to bring this new product mix into the terminals. They should, and will, be looking for their customers to commit volumes to them well in advance of the winter in order to avoid shortages and yes, backwardation.
Rich Larkin is President of risk management consultancy Hedge Solutions. He can be reached at rlarkin@hedgesolutions.com or 800-709-2949. www.hedgesolutions.com
The information provided in this market update is general market commentary provided solely for educational and informational purposes. The information was obtained from sources believed to be reliable, but we do not guarantee its accuracy. No statement within the update should be construed as a recommendation, solicitation or offer to buy or sell any futures or options on futures or to otherwise provide investment advice. Any use of the information provided in this update is at your own risk.
Related Posts
 Are Tight Supplies and High Prices in Store for the Winter?
Posted on September 18, 2025
 Weather or Not? Hedging Against Warm Winters Using Weather Derivatives
Posted on August 18, 2025
 2025 Hedging Survey
Posted on April 29, 2025
 Trump Policies and Energy Markets
Posted on April 28, 2025
Enter your email to receive important news and article updates.


